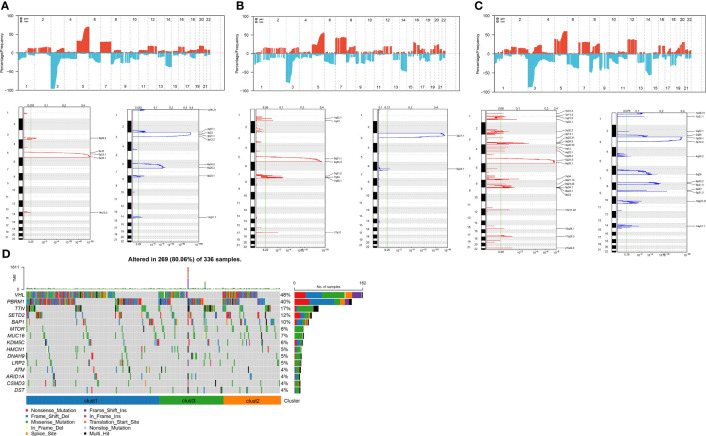
Figure 6.
Copy number variation landscape among different subtypes. (A) Peak plot of gene copy number amplifications (in red) and deletions (in blue) in clust1 subtype.; (B) Peak plot of gene copy number amplifications (in red) and deletions (in blue) in clust2 subtype.; (C) Peak plot of gene copy number amplifications (in red) and deletions (in blue) in clust3 subtype.; (D) Waterfall plot of the top 15 genes with the most SNV mutations among subtypes.

