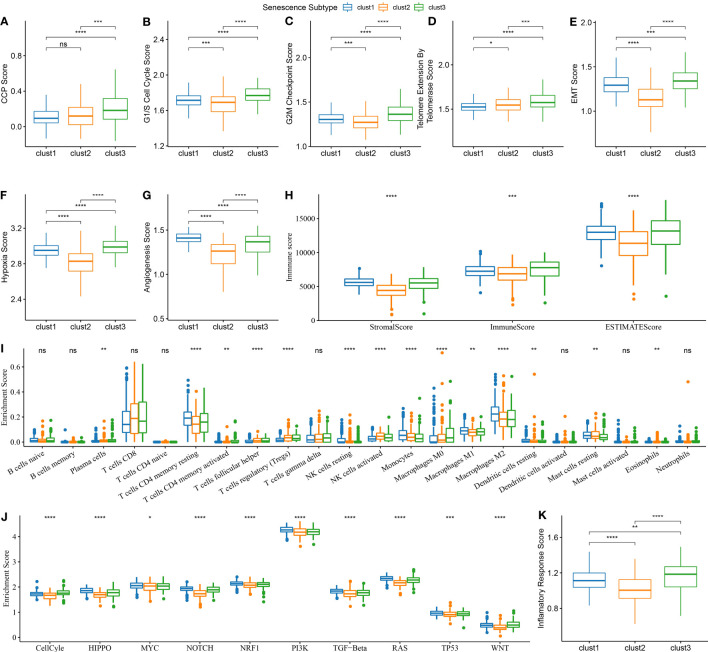
Figure 7.
Biological features comparison between different aging subtypes in ccRCC from TCGA dataset. (A) Comparison of CCP scores among three subtypes in TCGA dataset; (B) Comparison of G1/S phase scores among three subtypes in TCGA dataset; (C) Comparison of G2M checkpoint scores among three subtypes in TCGA dataset; (D) Comparison of telomerase activity scores among three subtypes in TCGA dataset; (E) Comparison of EMT scores among three subtypes in TCGA dataset; (F) Comparison of hypoxia scores among three subtypes in TCGA dataset; (G) Comparison of angiogenesis scores among three subtypes in TCGA dataset; (H) Comparison of immune scores calculated by ESTIMATE among three subtypes in TCGA dataset; (I) Comparison of 22 immune cell scores calculated by CIBERSORT among three subtypes in TCGA dataset; (J) Comparison of tumor-related pathway scores among three subtypes in TCGA dataset; (K) Comparison of inflammation scores among three subtypes in TCGA dataset. ns, p≥0.05; *, p< 0.05; **, p<0.01; ***, p<0.001; ****, p<0.0001.

