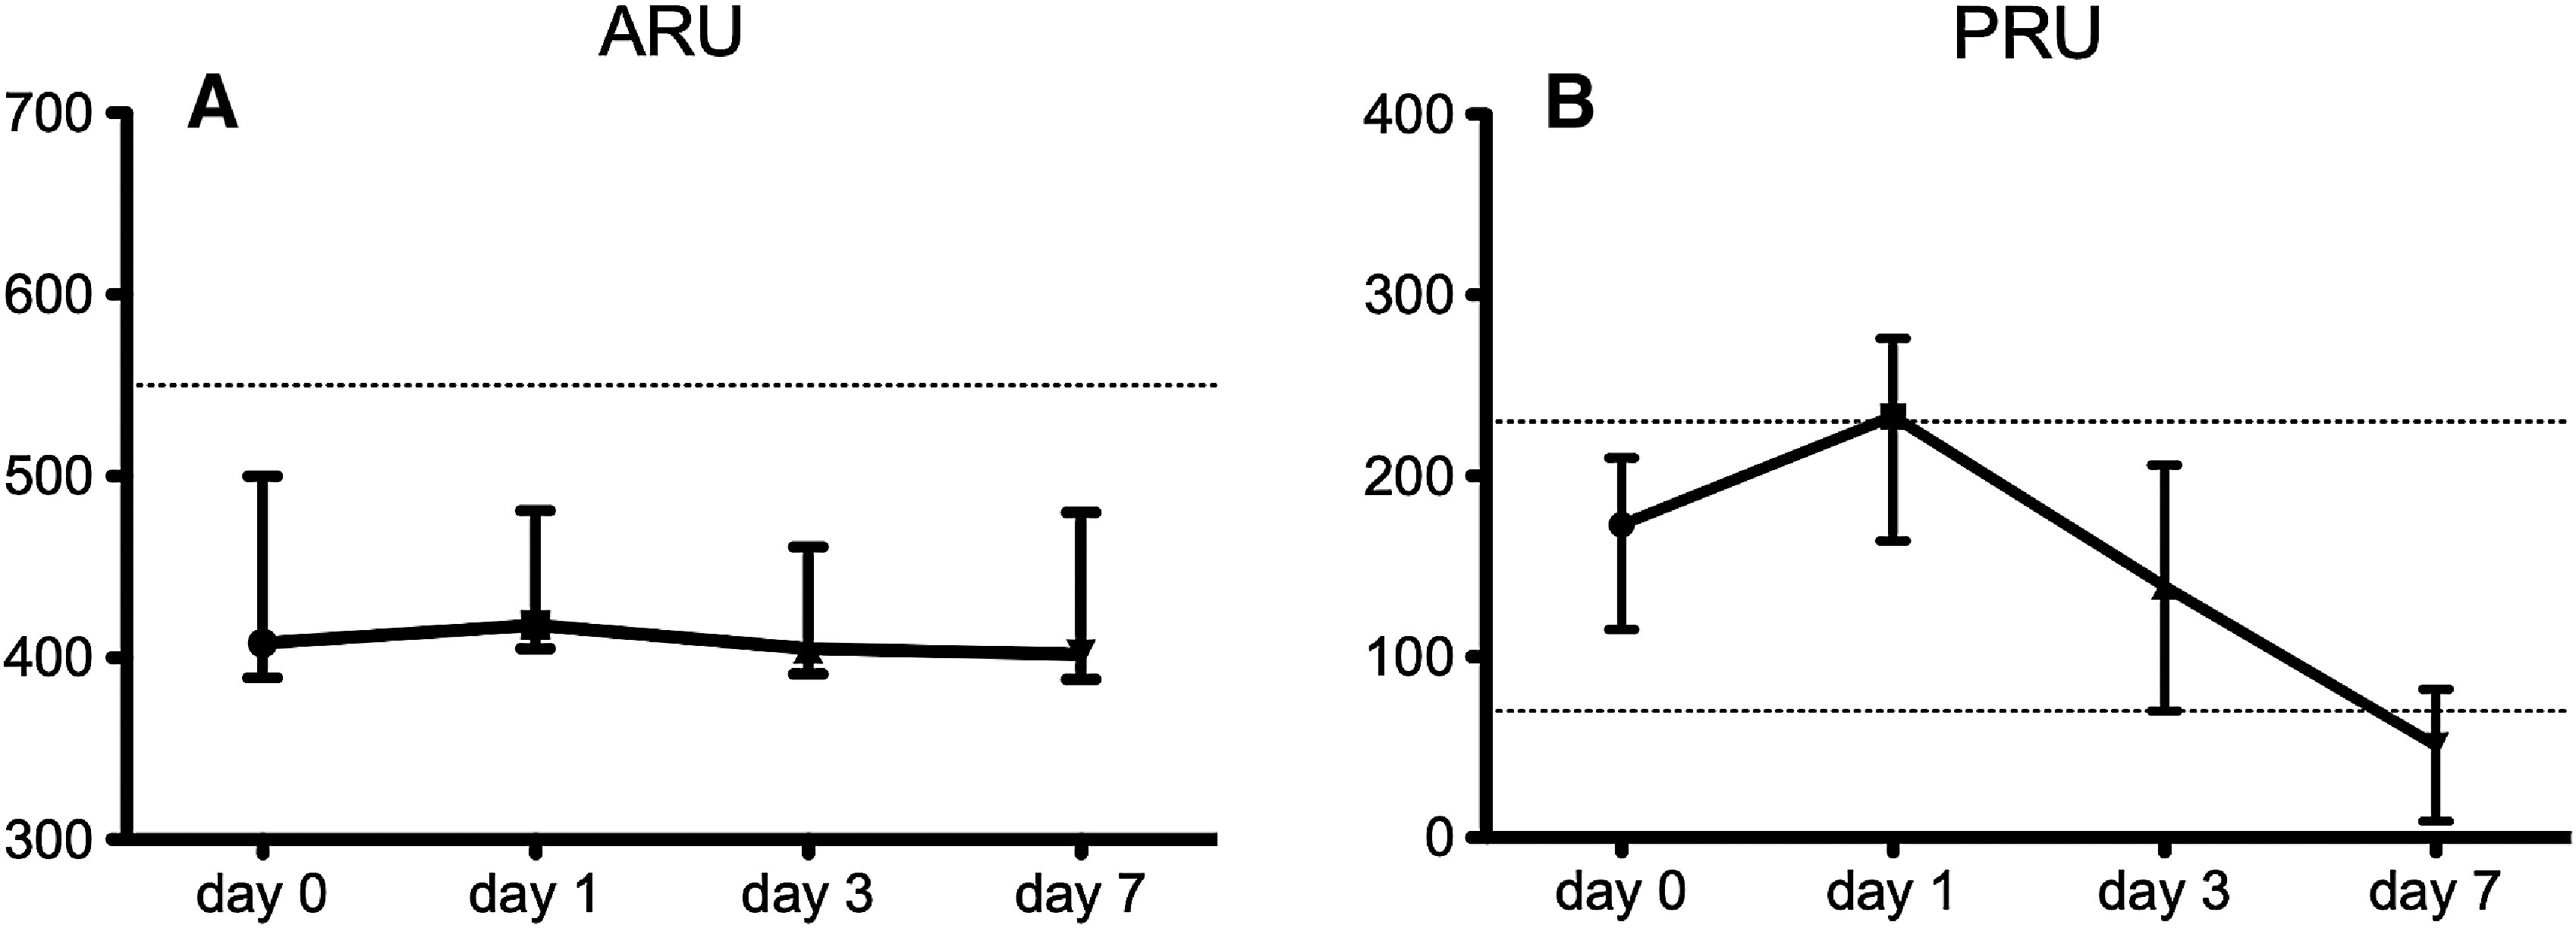
Fig. 1. Time-dependent changes in ARU and PRU values. (A) ARU changes. The dotted line indicates the cutoff value. No significant differences between any of these values were detected (Wilcoxon signed-rank test adjusted by Holm’s method). (B) Changes in PRU values. The dotted lines indicate upper and lower cutoff values. All combinations of time points differ significantly (Wilcoxon signed-rank test adjusted by Holm’s method). ARU: aspirin reaction unit; PRU: P2Y12 reaction unit.

