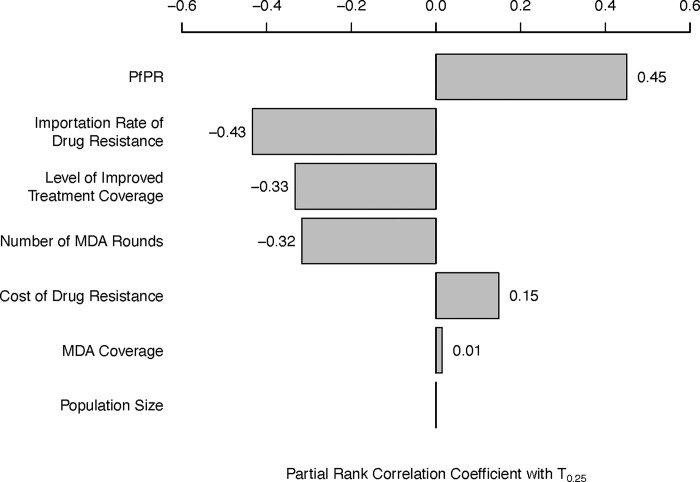
Fig 6. Tornado plot of Partial Rank Correlation Coefficient (PRCC) between various epidemiological variables (left column) and the time until artemisinin-resistance allele frequency reaches 0.25 (T.25).
T.25 is found to be positively correlated with PfPR (r = 0.45), and negatively correlated with importation rate (r = -0.43), the post-MDA level of improved treatment coverage (r = -0.33), and the number of deployed MDA rounds (r = -0.32). Fitness cost of drug resistance has a moderate positive correlation with T.25 (r = -0.15). MDA coverage and population size are not associated with slower or faster artemisinin-resistance evolution (r = 0.01, p = 0.002 and r = 0, p = 0.9, respectively). All p-values are lower than 10−5 except where indicated.

