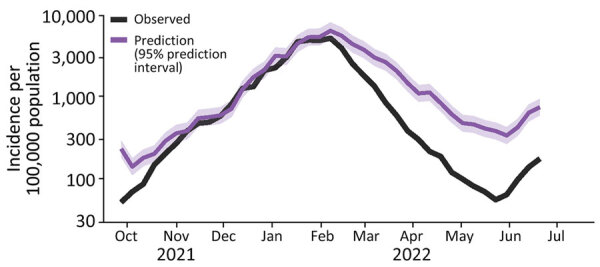
Figure 3.

Predicted COVID-19 incidence at a constant testing rate (purple) based on the national model, compared with observed incidence (black), in study of wastewater surveillance data as a predictor of COVID-19 incidence, Denmark. The prediction is an estimate of the true incidence. The proportion of estimated true cases captured decreased from >80% to ≈20% during 2022.
