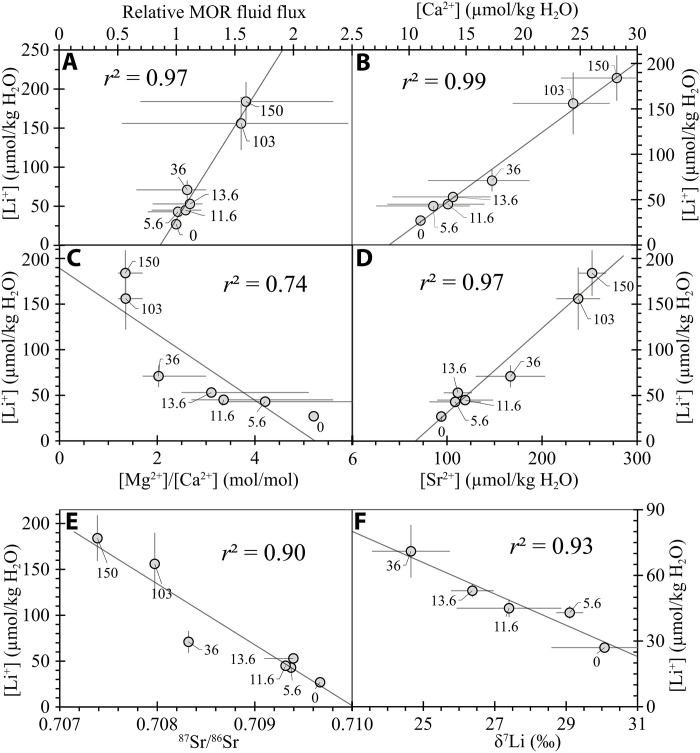
Fig. 3. Covariation of [Li+] with MOR fluid flow and seawater constituents.
[Li+] in seawater from fluid inclusions versus relative MOR fluid flux (A) (38), seawater [Ca2+] (B) (7, 24, 25), Mg2+/Ca2+ (C) (7, 24, 25), [Sr2+] (D) (30), 87Sr/86Sr (E) (2), and δ7Li (F) (3). Ages in million years adjacent to symbols show average values of seawater [Li+], [Ca2+], Mg2+/Ca2+, [Sr2+], 87Sr/86Sr, and δ7Li with 1σ (2SE for [Sr2+]) and 2σ (δ7Li) error bars. Linear regressions show the relationship between [Li+]SW and MOR fluid flow and other marine records.

