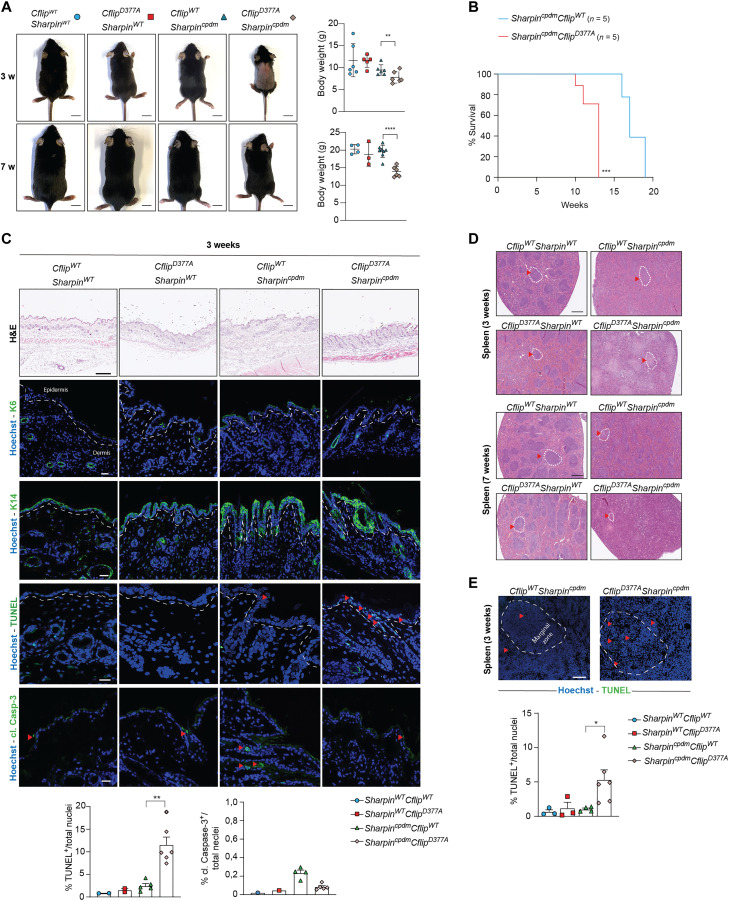
Fig. 5. Abrogation of cFLIP cleavage exacerbates the phenotype of Sharpin mutant mice.
(A) Pictures (left) and body weight (right) of 3- and 7-week-old CflipWTSharpinWT, CflipD377ASharpinWT, CflipWTSharpincpdm, and CflipD377ASharpincpdm mice. Each symbol corresponds to one mouse. Scale bars, 1 cm. Data are presented as means ± SD; **P < 0.01, ****P < 0.0001. (B) Kaplan-Meier survival curve of CflipWTSharpincpdm and CflipD377ASharpincpdm mice. The mice were euthanized when the termination criteria, based on the severity of dermatitis, were reached. ***P < 0.001. (C) Representative skin sections of 3-week-old mice of the indicated genotypes stained with H&E, K6, K14, cleaved Caspase-3, and TUNEL. Nuclei were stained with Hoechst. White dashed lines separate the epidermis from the dermis. Red arrowheads indicate TUNEL- and cleaved Caspase-3–positive cells. The graphics represent the percentage of TUNEL- and cleaved Caspase-3–positive cells over the total number of cells. Data are presented as means ± SD; **P < 0.01. Scale bars 20 μm. (D) Representative images of spleen sections of 3- and 7-week-old mice of the indicated genotypes [as in (A)] stained with H&E. Scale bars, 500 μm. Dotted circles and red arrowheads indicate marginal zones. (E) Representative pictures of TUNEL staining of spleen sections of 3-weeks-old mice of the indicted genotypes (top) and the relative quantification (bottom) expressed as percentage of TUNEL-positive cells over the total number of cells. Hoechst stains nuclei. Red arrowheads indicate TUNEL-positive cells. Data are presented as means ± SD; *P < 0.05. Scale bars, 100 μm.

