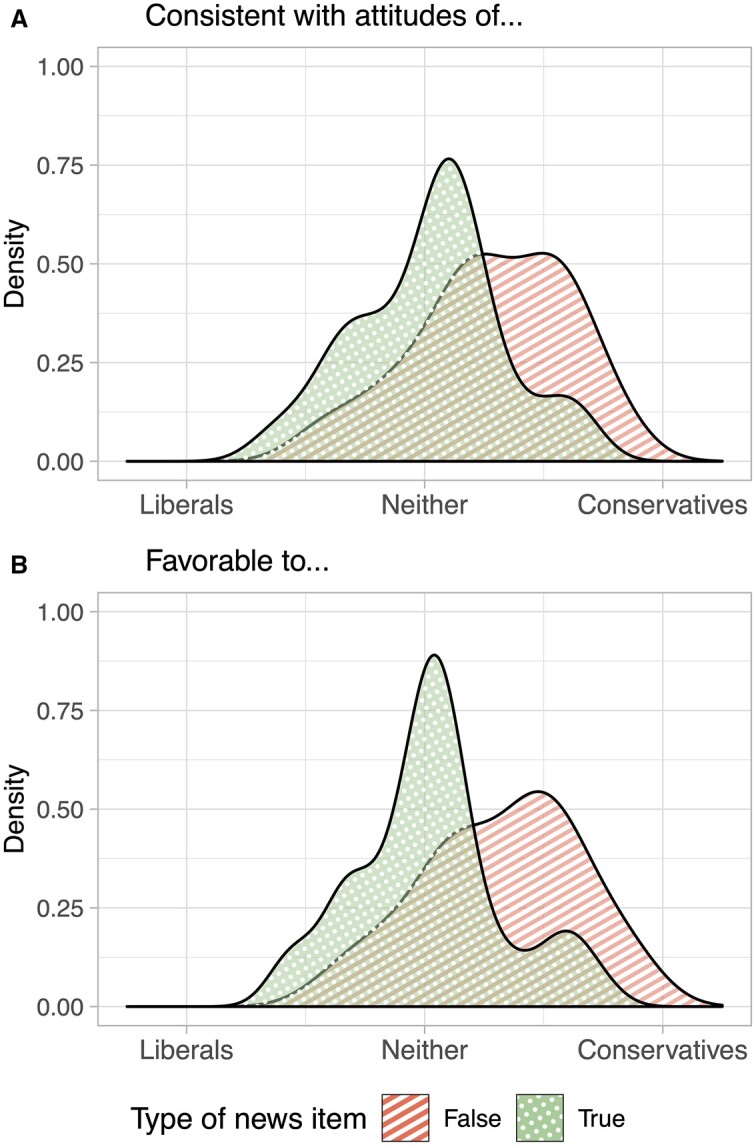
Figure 2.

Valence distribution of news items as measured in a pre-test, grouped by item truth. Panel (A) shows density plots of item-level rating averages for whether a news item is “more consistent with the beliefs of liberals or of conservatives or neither.” Panel (B) shows the density for rating average for whether an item is “more favorable to liberals or conservatives or neither.”
