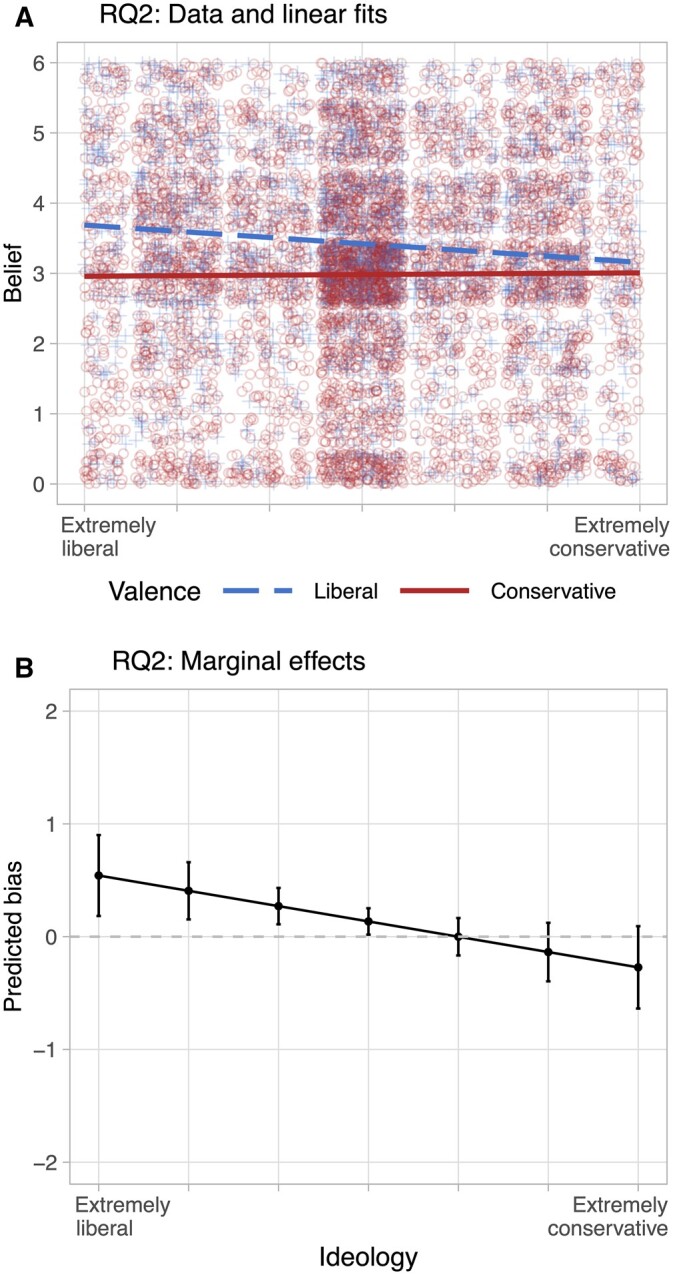
Figure 4.

Asymmetries in bias. Panel (A) plots belief of news item against subject ideology, grouped by ideological valence of item. The linear fits illustrate that bias is smaller for conservatives. Panel (B) plots predicted bias based on the interaction of individual ideology and item congruence, as estimated in model RQ2 in table 1.
