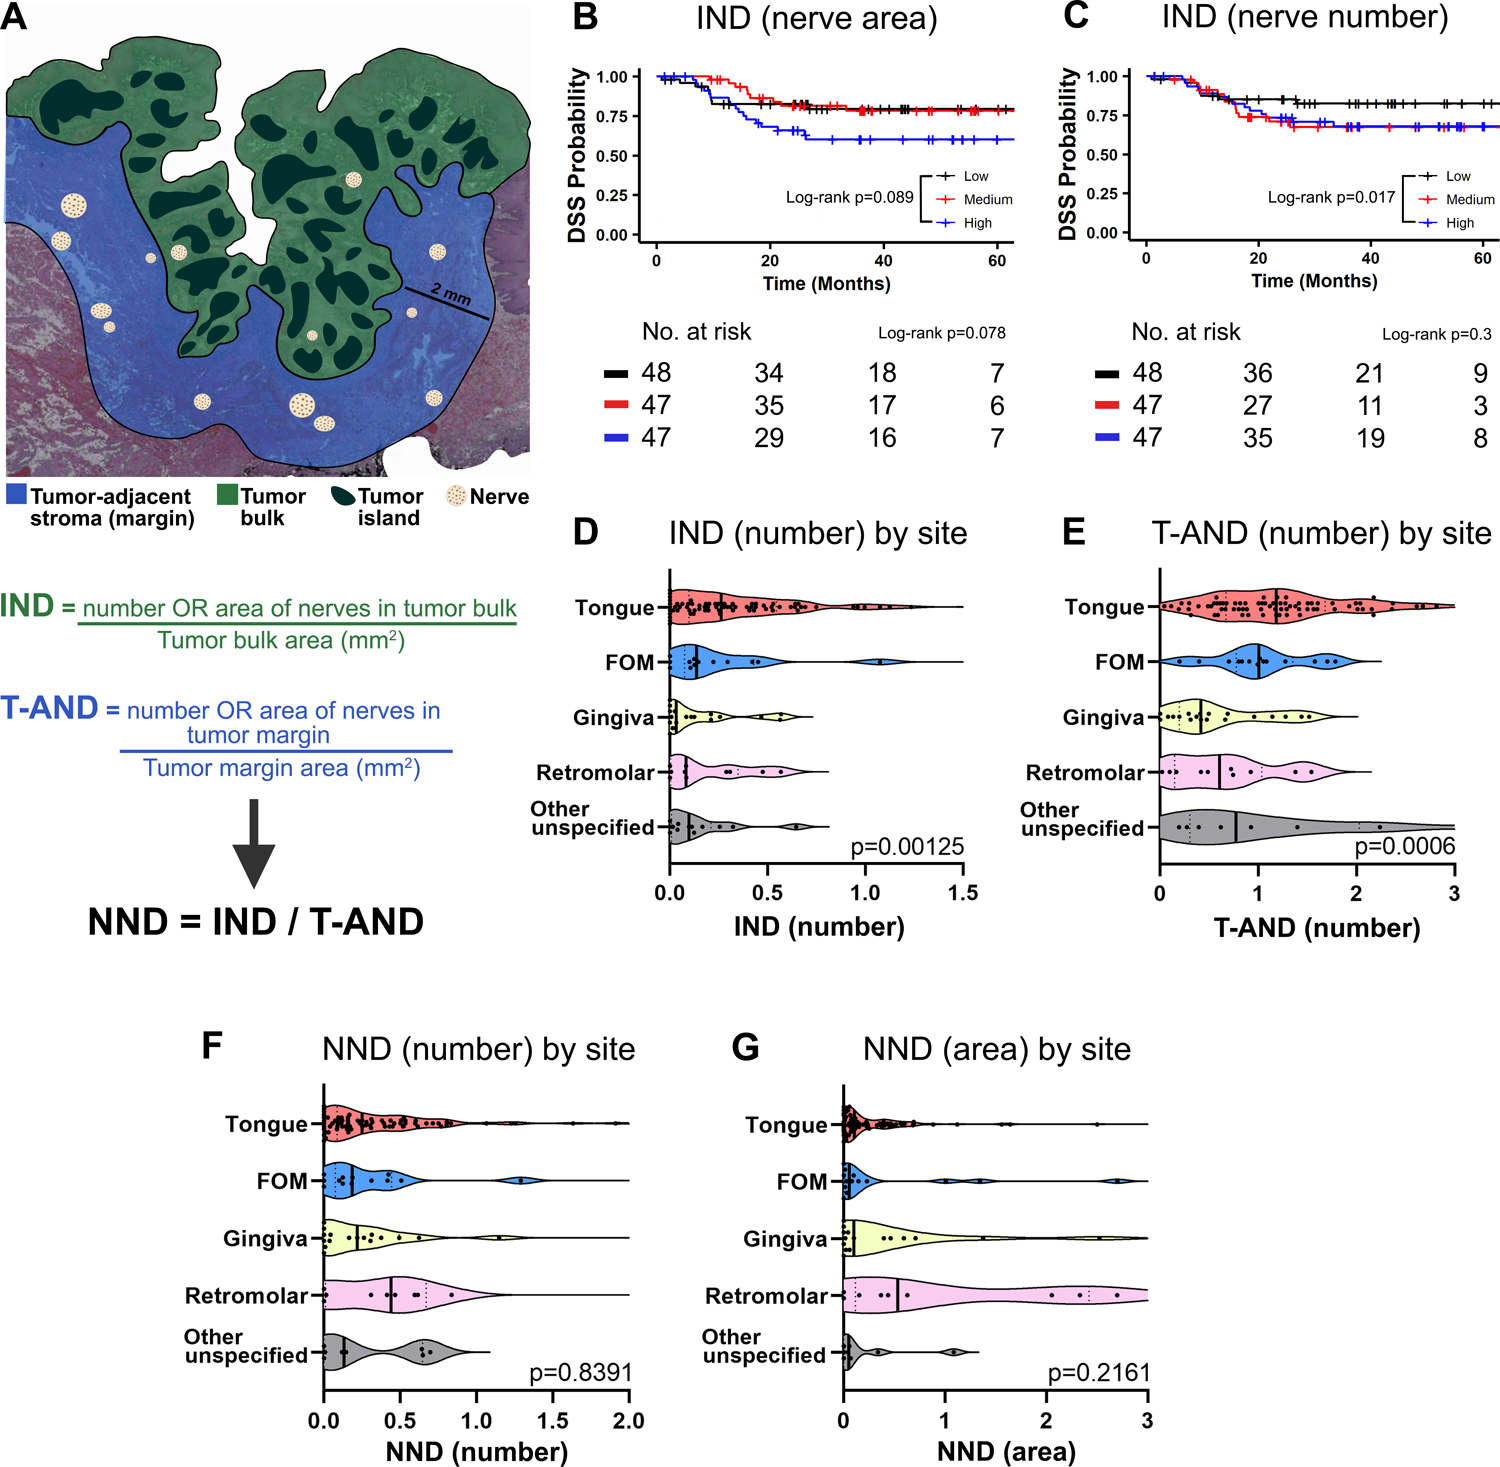
Figure 1: Intratumoral nerve density associates with poor survival in OSCC.

A, Schematic representation of zones for nerve density analysis. B and C, High intratumoral nerve density (IND) calculated using area (B) and number (C) of nerves associate with poor DSS. D, IND measured by number of nerves with patients grouped by tumor location. E, T-AND measured by number of nerves with patients grouped by tumor location. Note high IND and T-AND in tongue SCC in D and E. F, Normalized nerve density (NND) measured by number of nerves with patients grouped by tumor location. G, NND measured by area of nerves, and tumor location. B and C show Kaplan-Meier survival curves with log-rank statistics; patients are split by tertiles of IND using area (B), and number (C) of nerves. The number of patients at risk for each time point is shown below each plot. Kruskal-Wallis test was used in D through G, a few datapoints were excluded/cut from D-G plots for better visualization but all data was considered for analysis; FOM = floor-of-mouth.
