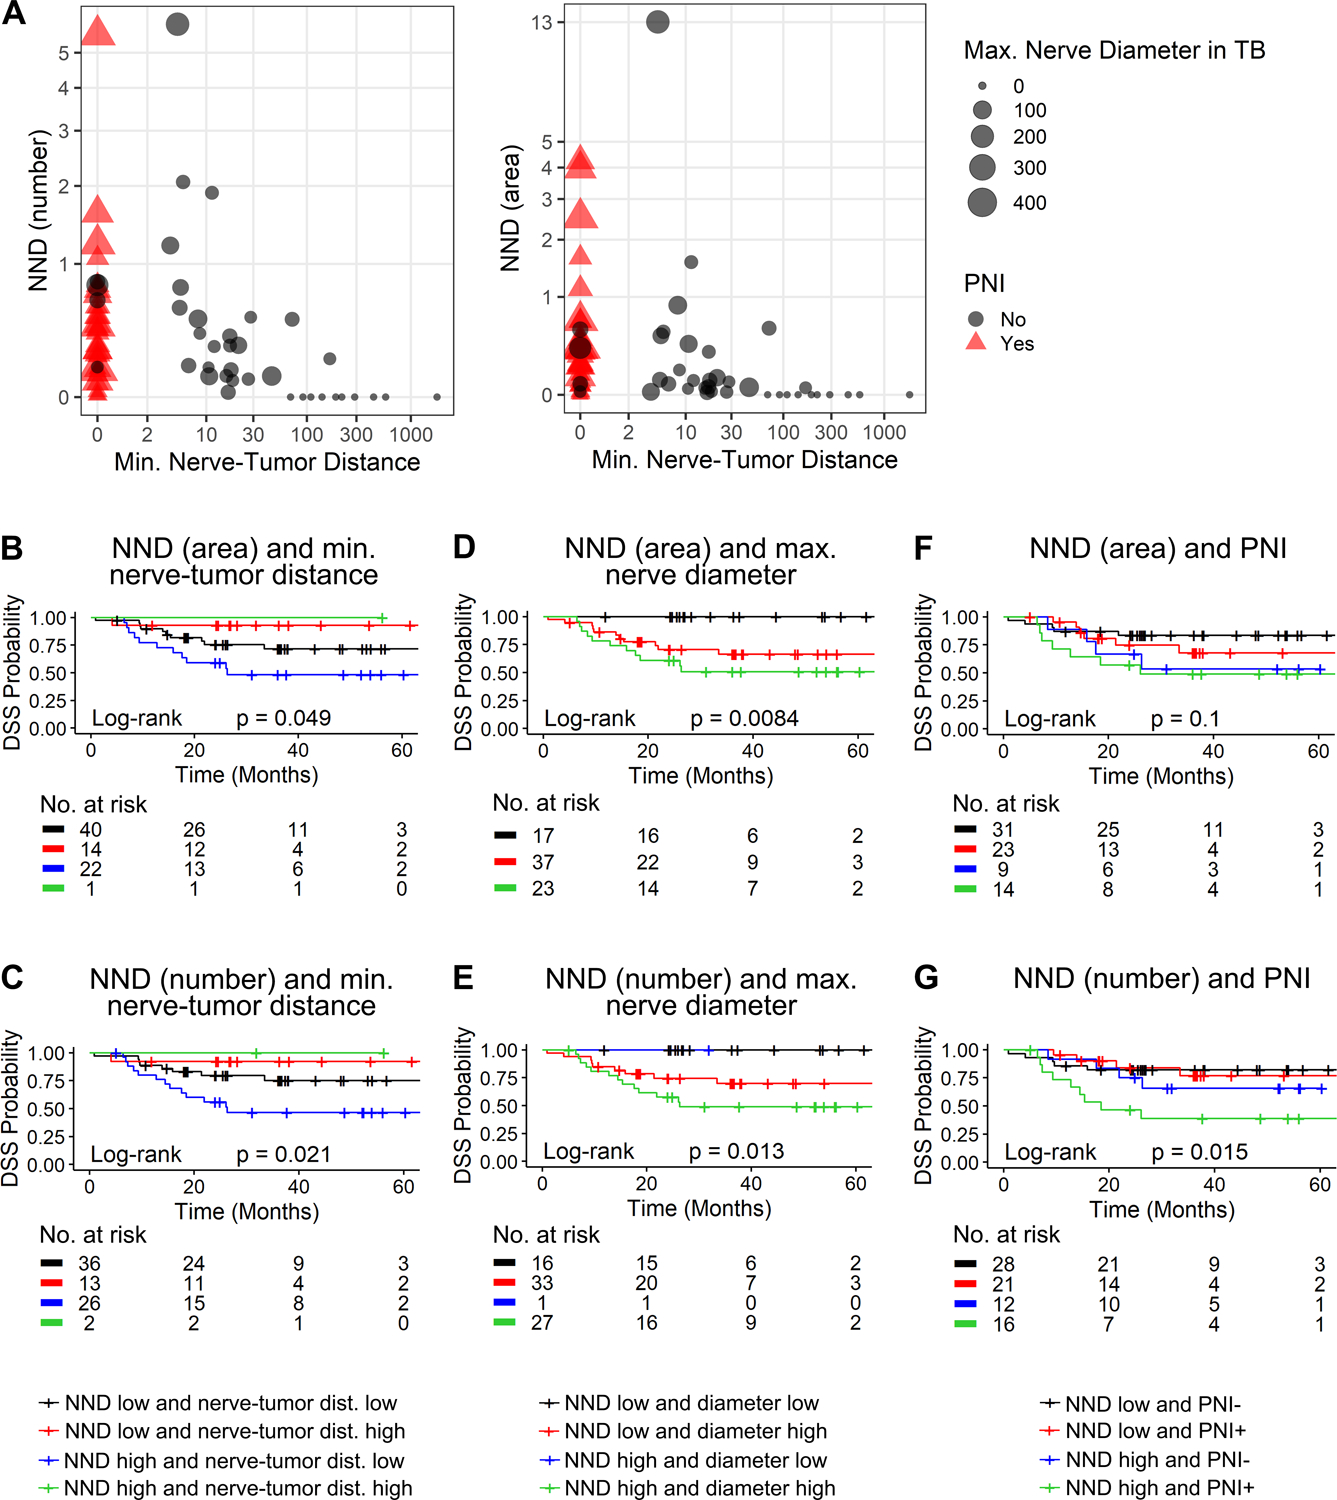
Figure 3: NND helps predict survival in association with other nerve-related parameters.

A, Multidimensional plots of NND versus minimum nerve-tumor distance, classifying patients by maximum nerve diameter in the tumor bulk and PNI status; NND measured with number (left plot) and area (right plot) of nerves. Kaplan-Meier curves of NND and other nerve-related parameters; minimum nerve-tumor distance (B and C), maximum nerve diameter in the tumor bulk, (D and E), and PNI (F and G). Overall log-rank statistics are shown within each plot in B through G; patients are split by cut-offs obtained by regression-tree analyses for nerve-tumor distance (27.63 μm) and diameter (26.39 μm). NND cut-off is defined as the high tertile of NND (0.42). The number of patients at risk for each time point is shown below each plot.
