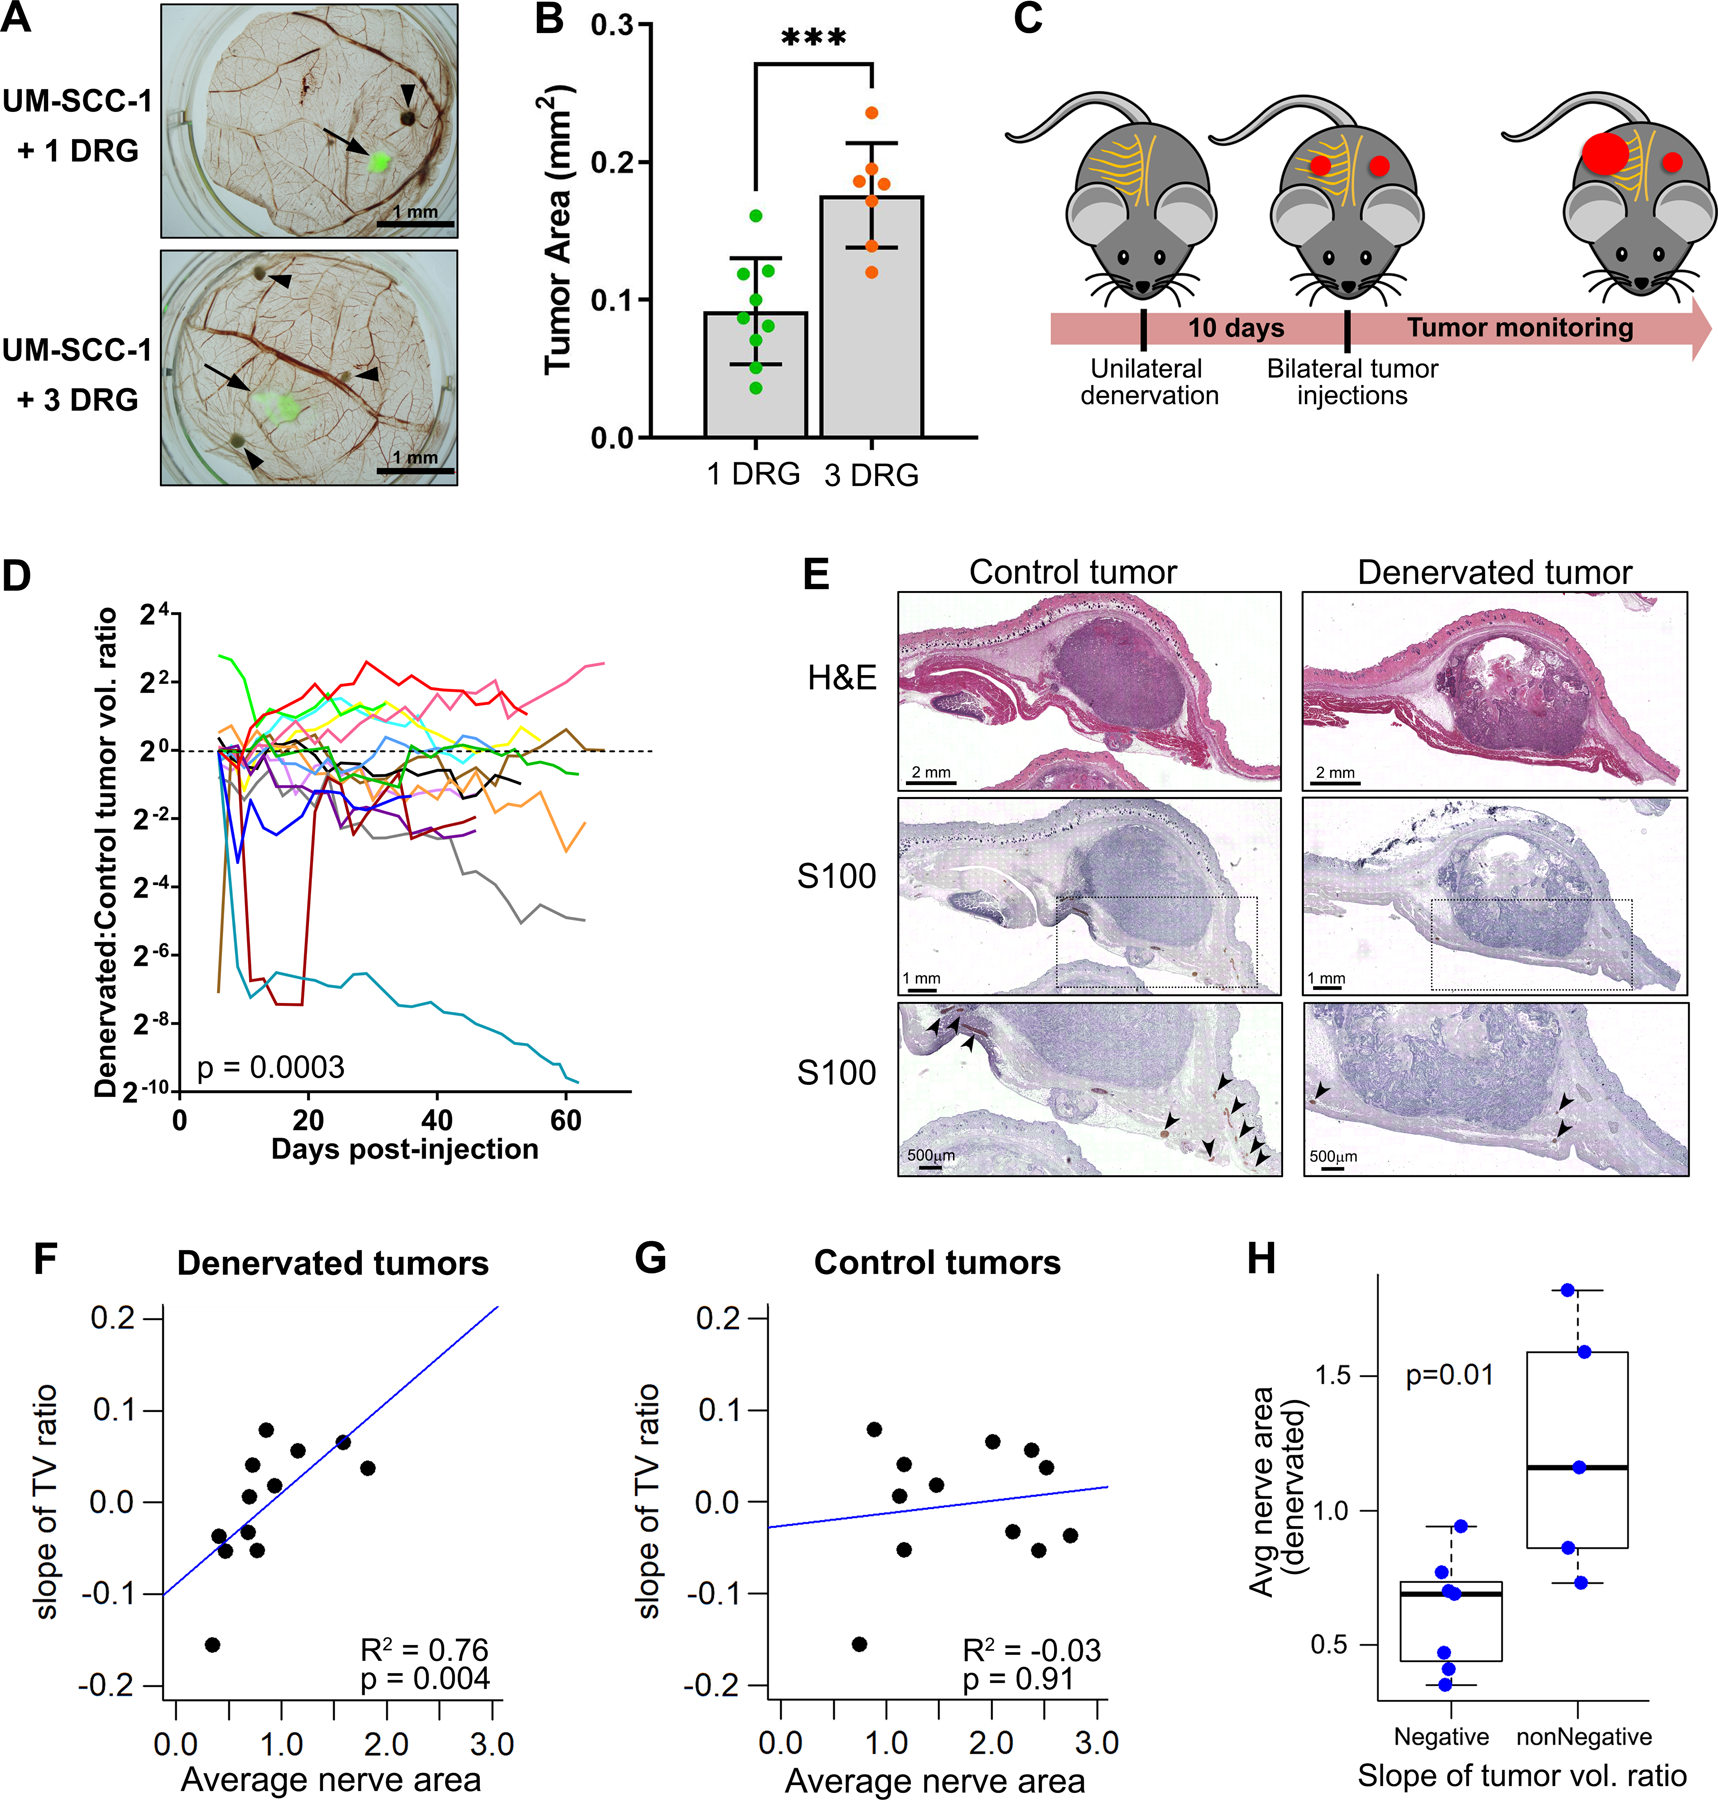
Figure 5: High nerve density increases tumor growth.

A, In vivo assessment of nerve density using the CAM-DRG model. DRGs were grafted on day 8 and fluorescently labeled UM-SCC-1 cells on day 10; upper CAMs were harvested on day 14. Arrows show labeled UM-SCC-1 cells, arrowheads show DRG locations. B, Tumor area quantification based on fluorescence; unpaired t-test p-value: *** <0.01. C, Schematic representation of surgical denervation. Subcutaneous dorsal nerves were removed unilaterally from C57BL6/J mice with sham surgery on the contralateral side. MOC1 cells were injected bilaterally after 10 days. D, Denervated/ control tumor volume ratio; each mouse is represented by a different color (n = 16; linear mixed model p-value = 0.0003). E, Histologic sections of control and denervated tumors. S100 stain facilitated nerve assessment in tissue sections. Arrows show nerve segments. F and G, Correlation between slope of tumor volume ratio and average nerve area on denervated (F) and control tumors (G). Strong positive correlation on the denervated side; Spearman correlation coefficients p-values are shown. H, Average nerve area in denervated tumors versus denervated:control slope of tumor volume ratio over time. Negative slope refers to mice where denervated tumors were smaller than control; non-negative slope has opposite behavior or no differences between denervated and control (t test p-value is shown).
