
Fig. 2.
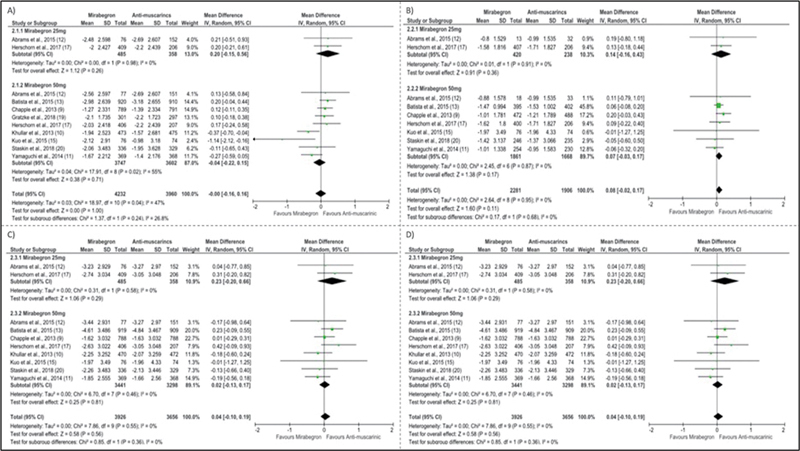
Forest plots showing efficacy outcome: ( A ) Number of urinations every 24h, ( B ) Urge incontinence episodes, ( C ) Urgency; D: Urinary leakage episodes.
Official websites use .gov
A
.gov website belongs to an official
government organization in the United States.
Secure .gov websites use HTTPS
A lock (
) or https:// means you've safely
connected to the .gov website. Share sensitive
information only on official, secure websites.
Forest plots showing efficacy outcome: ( A ) Number of urinations every 24h, ( B ) Urge incontinence episodes, ( C ) Urgency; D: Urinary leakage episodes.