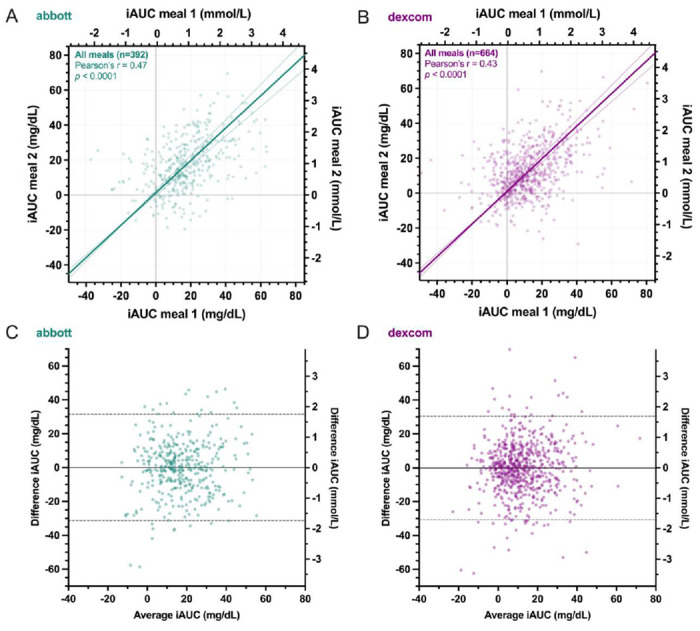
Figure 1.

Comparison of incremental area under the curve (iAUC) of postprandial glucose responses to duplicate meals using A) Abbott and B) Dexcom continuous glucose monitors. Trendline is major axis regression with 97.5% CIs. Bland-Altman plots of the iAUC differences between duplicate meals versus the average of both measurements using C) Abbott and D) Dexcom devices. Solid line indicates mean bias and dashed lines indicate 95% limits of agreement.
