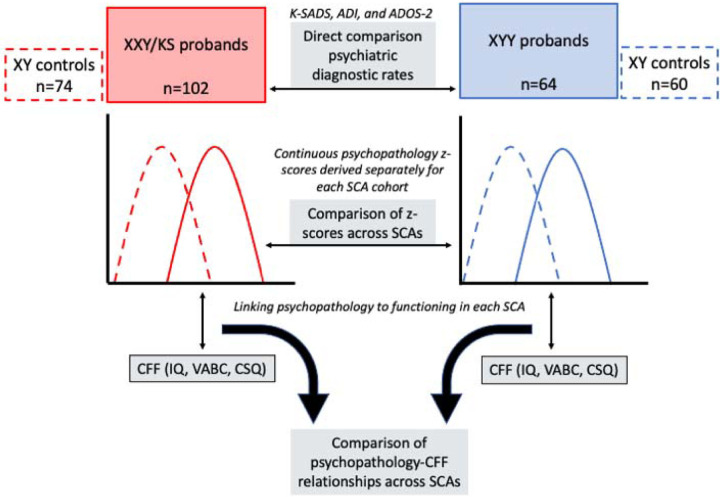
Figure 1. Schematic of analytic workflow.
Gold-standard diagnostic assessments were completed for each SCA group and diagnostic rates were compared directly across groups. For each SCA group, z-scores were calculated per psychopathology scale based on the distribution of raw scores in each respective XY control group (middle row). These z-scores were then related to each CFF (IQ, VABC, CSQ) using linear regression (bottom row). The outputs of these regression models were compared using correlations and orthogonal regression to determine if the coupling between psychopathology and CFFs differed as a function of SCA group.

