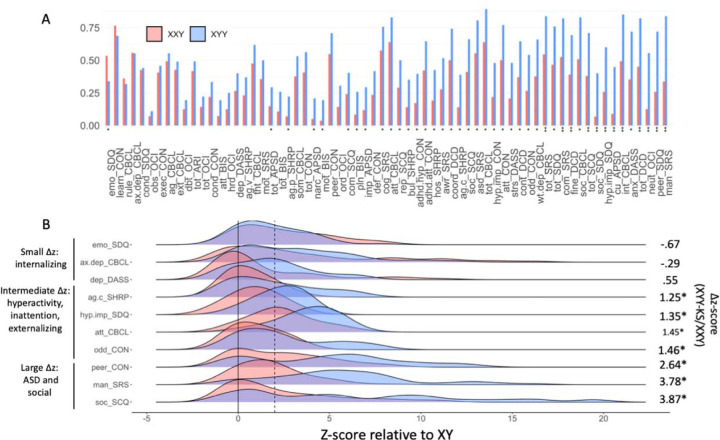
Figure 3. Direct comparisons of extreme score rates for 66 dimensional measures of psychopathology between XXY/KS and XXY syndrome, with illustrative score distributions for selected traits.
(A) Bar graph displaying the proportion of individuals with a z-score > 2 SDs above their respective control group (XXY/KS = red, XYY = blue). Subscales are arranged in order of ascending proportion difference (XYY-XXY/KS). One asterisk (*) indicates the p-value for the chi-square statistic is less than .05, two asterisks (**) denotes the p-value is less than .00076. (B) A selection of density plots illustrating the distribution of z-scores for a selected sample of subscales (XXY/KS = red, XYY = blue). Solid line is at z-score of 0 (indicating average of XY controls), and dashed line is at 2 (indicating 2 standard deviations above XY controls).

