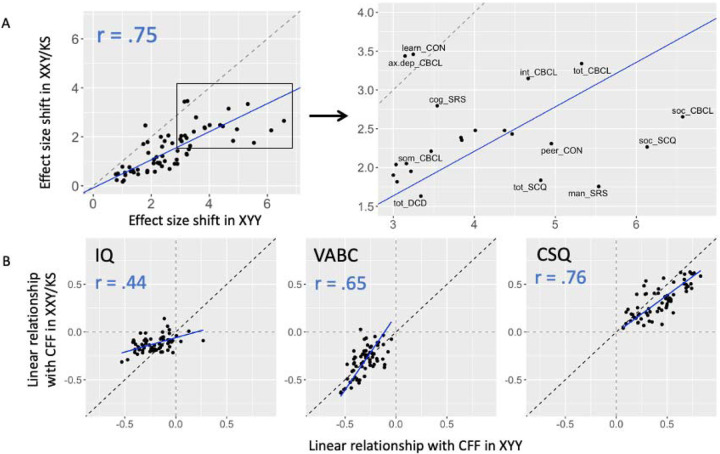
Figure 4. Orthogonal regression modeling to assess the concordance of psychopathological profiles and CFF coupling across SCAs.
(A) Scatterplot and orthogonal regression modeling the relationship between mean scores in XXY/KS and XYY for each scale. A point’s position along the x- and y-axes represent its mean effect in XYY and XXY/KS, respectively. A subset of the graph (boxed) is expanded to illustrate the position of scales which deviate the most drastically from the regression slope. (B) Scatterplot and orthogonal regression modeling the relationship between scales’ relationship with CFFs (IQ, VABC, and CSQ) in XXY/KS and XYY. A point’s position along the x- and y-axes represent the scale’s linear relationship with the CFF in XYY and XXY/KS, respectively.

