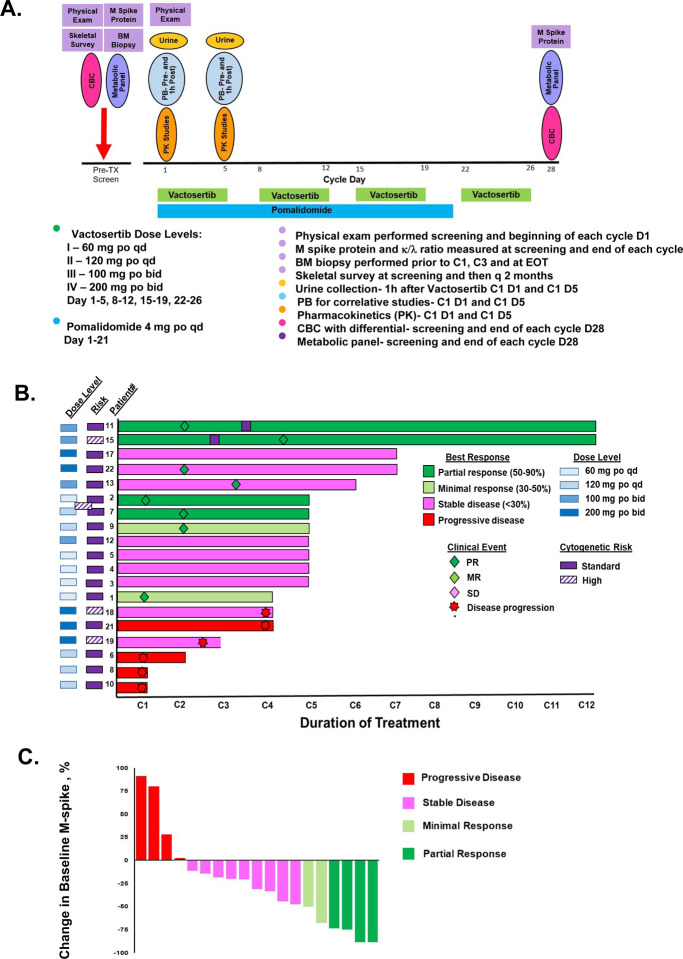
Figure 1. Trial design, Swimmer’s plot and Waterfall plot to evaluate the response of patients with RRMM to vactosertib combined with pomalidomide.
A. Vactosertib and pomalidomide dosing schedule and vactosertib dose levels for the phase 1b dose escalation cohort. Also shown is the schedule for clinical and laboratory testing. B. Shown is individual trajectories and outcomes over duration in the 19 patients that received full-dose treatment. C. Shown is the maximal change in M-spike value for the same 19 patients. Two patients (#14 and #16) were excluded from response and outcome analysis because of withdrawn consent or grade 4 toxicity.

