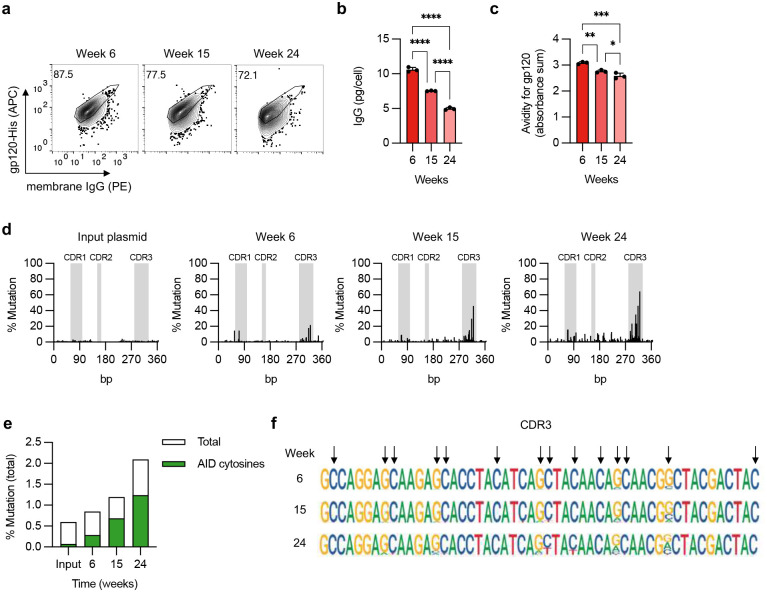
Figure 3. Evidence for somatic hypermutation of inserted J3 VHH sequences.
(a-d) FACS-sorted J3-edited Raji cells were cultured for 6 months without further selection. (a) J3-BCR expression by flow cytometry at indicated times, gated on IgG+ cells. (b) Cells from each time point were seeded at 106 cells/mL for 2 days and IgG secretion measured by ELISA, normalized for number of cells seeded. (c) Supernatants were assessed for gp120 binding by ELISA, across a range of normalized IgG concentrations. Absorbances across the curve were summed as a surrogate for area under the curve. See also Extended Data Fig. 4a. (d) Changes at J3 sequence in edited cells over time, measured by deep sequencing and compared to input homology donor plasmid. Percentage mutation at each position was calculated as the frequency of reads that did not match the wild-type sequence. CDR regions are indicated in gray. (e) Mutations identified by deep sequencing of J3-edited cells at each timepoint were summed and divided by the total sequence length to determine total % mutations. Shown in green are mutations associated with AID hotspot motif cytosines (WRCH). (f) Sequence logo plot of the CDR3 region of J3 at each time point. Arrows indicate AID hotspot cytosines, on either strand. Error bars show mean ± SEM. Statistics in panel (b-c) were performed by 1-way ANOVA.

