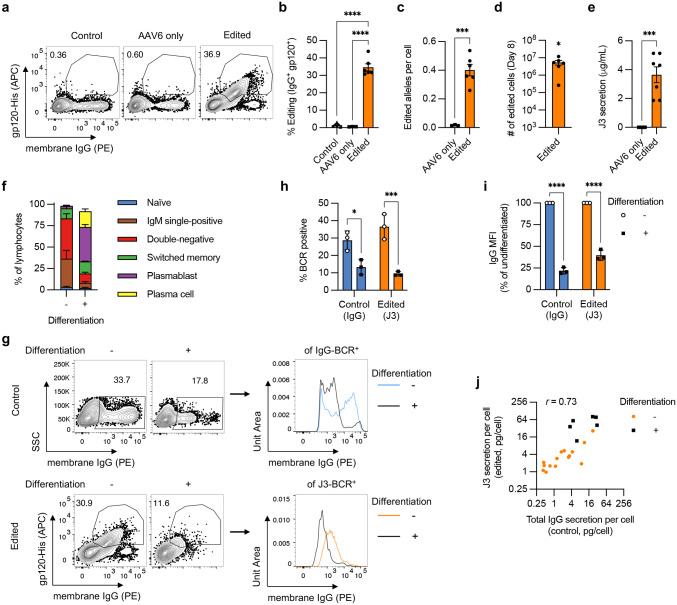
Figure 4. Engineering primary human B cells.
Primary human B cells from n = 3–6 independent experiments were activated with BAC in XF media, starting at day −3, and edited at day 0 with sg05 Cas9 RNPs and an AAV6-J3 homology donor (MOI = 5 × 10⁵ vg/cell). (a-b) Editing rates were measured at day 8 by flow cytometry for surface J3-BCR. (c) Editing was quantified by in-out ddPCR at day 8 and normalized per cell against a control reaction. (d) The yield of edited cells at day 8 was calculated from 5 × 10⁵ starting B cells. (e) J3 HCAb secretion was measured by gp120-IgG ELISA at day 8. (f-h) Edited B cells in BAC culture were differentiated by switching to the DP protocol on day 2 post-editing and cultured for a further 6 days. Undifferentiated populations were maintained in BAC until day 8. (f) B cell phenotypes, measured on day 8 by flow cytometry, as described in Supplementary Fig. 5. (g-i) Expression of total IgG-BCR (control, unedited samples) and J3-BCR (edited samples) was measured by flow cytometry at day 8 for cells without or with differentiation (n = 3). The intensity of membrane IgG expression was evaluated for IgG+ control B cells and J3+ edited B cells. Shown are representative plots (g) and summary graphs of IgG- or J3-BCR positivity (h) and expression levels (i) after differentiation, normalized to paired undifferentiated samples. Data for edited (J3) but undifferentiated cells in panel (h) is a subset of the data in panel (b). (j) Scatter plot comparing the rate of total IgG secretion from control unedited samples versus J3 HCAb secretion from edited samples. Each point represents measurements from paired samples from the same experiment. Samples were collected at several time points after editing, and differentiated samples are also identified. The Pearson correlation is indicated. Error bars show mean ± SEM. Statistics were calculated by 1-way ANOVA (b), 2-tailed t-test (c,e), 1-sample t-test (d), or 2-way ANOVA (h-i). * p < 0.05, *** p < 0.001, **** p < 0.0001.

