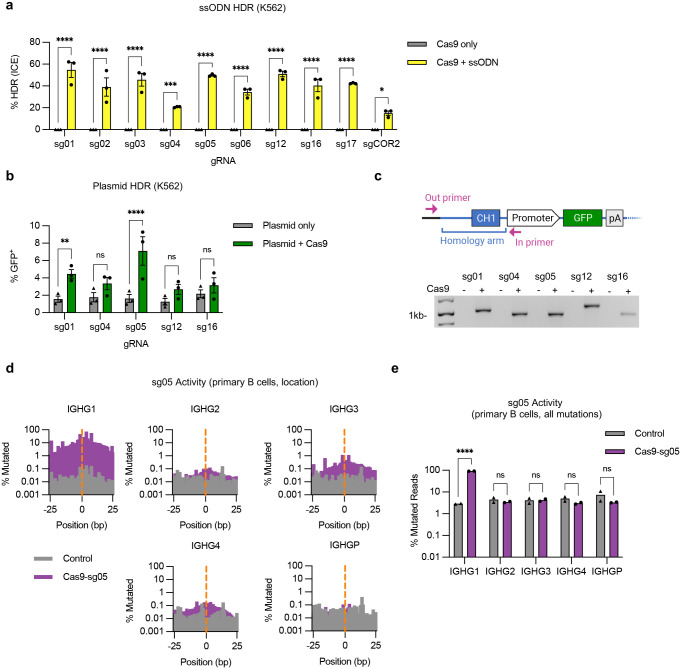
Extended Data Figure 1. Extended analyses of genome editing at the constant region of the IgH locus.
(a) K562 cells were electroporated with Cas9 RNPs containing indicated gRNAs and matched ssODN homology donors to insert an XhoI restriction site (n = 3). HDR editing was measured by Sanger sequencing and ICE analysis. (b) K562 cells were electroporated with Cas9 RNPs for indicated gRNAs and a matched plasmid homology donor containing a GFP expression cassette (n = 3). HDR editing was measured by flow cytometry for GFP expression after 3 weeks. (c) Site-specific insertion of GFP expression cassettes in AAV6-edited K562 cells was confirmed by in-out PCR for each tested gRNA. Uncropped gel is available in Supplementary Fig. 3a. (d) On- and off-target activity of sg05 was measured at indicated IGHG genes in primary human B cells, 5 days after editing, by targeted amplicon deep sequencing. Aggregate mutations at each base in a 50bp window surrounding the sg05 cut site (0; orange dotted line) are shown for each gene. (e) Percentage mutated reads at each IGHG gene calculated as for all changes (≥ 1 bp changed), which gives a higher background than when a cutoff of ≥ 2 bp is selected, as shown in Fig. 1d (n = 2). Error bars show mean ± SEM. Statistics were calculated by 2-way ANOVA. * p < 0.05, *** p < 0.001, **** p < 0.0001, ns = not significant.

