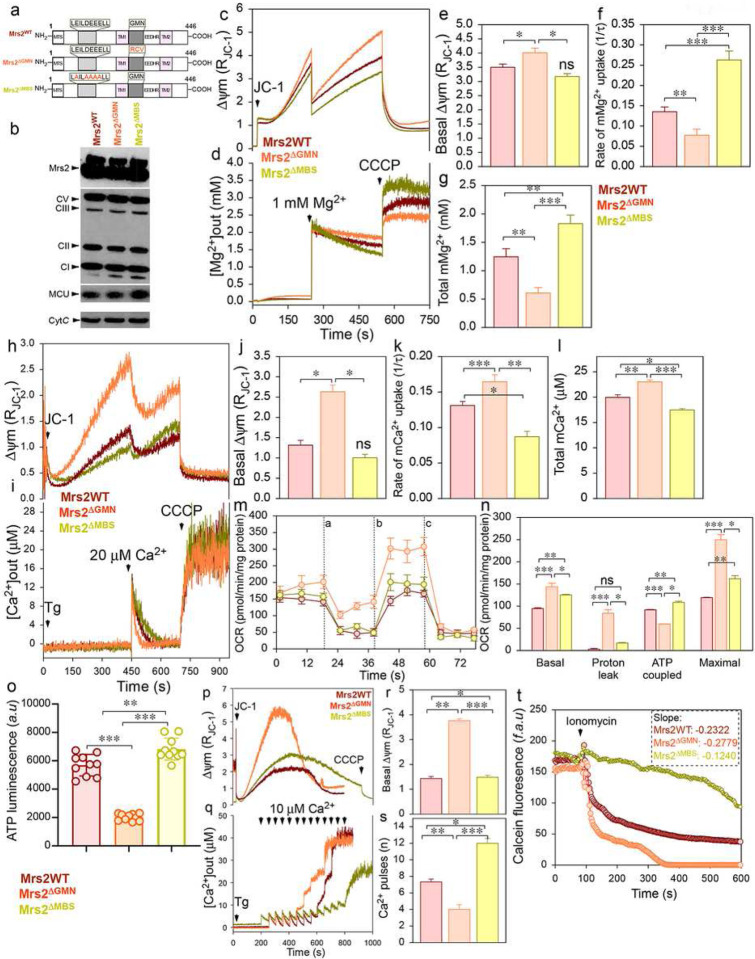
Figure 6. Mrs2 gain-of-function mutant augments mMg2+ uptake and prevents Ca2+-overload mediated PTP opening.
(a) Schematic of full-length Mrs2 with its functional domains (Mrs2WT). Mutations in Mrs2WT are highlighted in red (Mrs2ΔGMN and Mrs2ΔMBS). (b) Representative Western blot probed with antibodies specific for Flag shows the expression of Mrs2WT, Mrs2ΔGMN, and Mrs2ΔMBS in HEK293 WT cells. (c-g) Simultaneous measurement of Δψm and mMg2+ in HEK 293 cells expressing Mrs2WT, Mrs2ΔGMN, and Mrs2ΔMBS. Mean traces of Δψm (c) and [Mg2+]out (d). (e) Quantification of the basal Δψm before the addition of 1 mM Mg2+ pulse. (f) Quantifying the rate of mMg2+ uptake as a function of the decrease in [Mg2+]out after 1 mM Mg2+ pulse. (g) Quantification of the [Mg2+]out after CCCP addition. Data represents Mean ± SEM; *P<0.05, **P <0.01; n = 4. (h-l) Simultaneous measurement of Δψm and mCa2+ in HEK 293 cells expressing Mrs2WT, Mrs2ΔGMN, and Mrs2ΔMBS. Mean traces of Δψm (h) and [Ca2+]out (i). (j) Quantification of the basal Δψm before adding 20 μM Ca2+ pulse. (k) Quantification of the rate of mCa2+ uptake as a function of the decrease in [Ca2+]out after 20 μM Ca2+ pulse. (l) Quantification of the [Ca2+]out after CCCP addition. Data represent Mean ± SEM; **P<0.01, ***P <0.001; n = 4. (m) Mean traces of oxygen consumption rate (OCR) in HEK 293 cells expressing Mrs2WT, Mrs2ΔGMN, and Mrs2ΔMBS using pyruvate as a substrate and after sequential exposure to Oligomycin (a), FCCP (b), and rotenone/antimycin (c). (n) Quantification of basal, maximal OCR, proton leak, and ATP-coupled respiration. Data indicate Mean ± SEM; *P < 0.05, **P < 0.01, ***P < 0.001; n = 10. (o) Quantification of total cellular ATP levels in HEK 293 cells expressing Mrs2WT, Mrs2ΔGMN, and Mrs2ΔMBS. (p-s) Simultaneous measurement of Δψm and mCa2+ in HEK 293 cells expressing Mrs2WT, Mrs2ΔGMN, and Mrs2ΔMBS. Mean traces of Δψm (p) and [Ca2+]out (q) after a series of 10 μM Ca2+ pulses. (r) Quantification of the basal Δψm before adding the first 10 μM Ca2+ pulse. (s) Quantification of the number of Ca2+ pulses handled before the loss of Δψm. Bar represents Mean ± SEM; **P < 0.01, ***P < 0.001; n = 4–7. (t) Mean traces of mitochondrial calcein fluorescence in HEK 293 cells expressing Mrs2WT, Mrs2ΔGMN, and Mrs2ΔMBS before and after adding ionomycin (5 μM).

