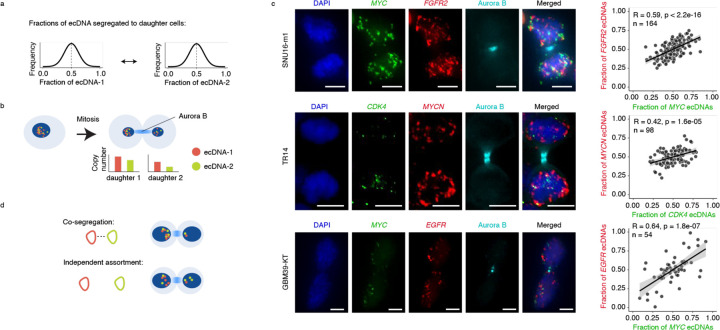
Figure 2. Distinct ecDNA species are co-segregated into daughter cells during mitosis.
(a) Copy numbers of individual ecDNA species in a daughter cell after segregation are predicted to follow a Gaussian distribution due to random segregation. (b) Pairs of daughter cells undergoing mitosis are identified by immunofluorescence for Aurora kinase B (Aurora B). Individual ecDNA species are visualized using FISH probes targeting specific oncogene sequences for copy number quantification. (c) Representative images of pairs of daughter cells undergoing mitosis (left). Scatter plots showing Pearson correlations of per-cell ecDNA contents containing the indicated oncogene sequences in daughter cells (right). Scale bars are 5 µm. (d) Schematic of co-segregation and independent assortment of multiple ecDNA species in mitosis.

