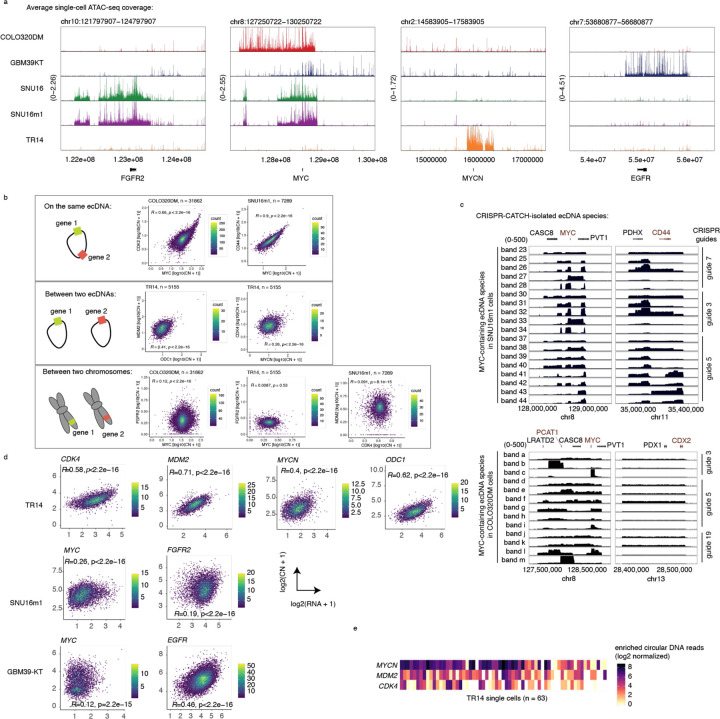
Extended Data Figure 2. Distinct ecDNA amplifications co-occur and correlate at the single-cell level and their copy numbers affect transcriptional outcomes of oncogenes.
(a) Elevated scATAC-seq background coverages of oncogene loci in correspondence to ecDNA copy number amplification in the various indicated cell lines. (b) Density scatter plots showing levels of copy number correlation between gene pairs on the same ecDNA, on different ecDNAs, and on different chromosomes. (c) Sequencing coverages of ecDNA species isolated by CRISPR-CATCH from SNU16m1 cells and COLO320DM cells, identifying genes that are frequently linked on the same ecDNA species (Methods). Each row represents a distinct ecDNA species isolated by molecular size fractionation using CRISPR-CATCH. Gene annotations in red are gene pairs classified as being on the same ecDNA in Figure 1. All guide sequences are provided in Supplementary Table 1. (d) Density scatter plots showing correlation between oncogene copy number and RNA expression in paired scATAC-seq and RNA-seq. Cells with zero values were filtered. (e) Heatmap showing co-enrichment of circular DNA species containing MYCN, MDM2 or CDK4 in individual TR14 neuroblastoma cells in scCircle-seq.

