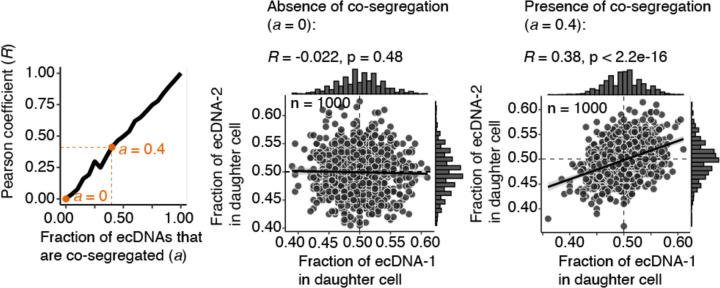
Extended Data Figure 3. Copy number correlation between ecDNA species in daughter cells undergoing mitosis suggests co-segregation.
Segregation of two ecDNA species with 100 copies each was simulated by random sampling with varying levels of co-segregation (1000 simulations per co-segregation fraction a; Methods). As the fraction (a) of ecDNAs that are co-segregated increases from 0.00 (no co-segregation) to 1.00 (each copy of one ecDNA species is perfectly co-segregated with a copy of another species) in increments of 0.05, the Pearson coefficient R of the copy numbers of two ecDNA species in individual daughter cells increases linearly (left panel). Thus, in the absence of co-segregation, no copy number correlation in mitotic daughter cells is expected (middle panel), while in the presence of a modest level of co-segregation (a fraction of 0.4, or 40% of one ecDNA species co-segregating with 40% of another), a Pearson coefficient R of 0.38 is expected (right panel).

