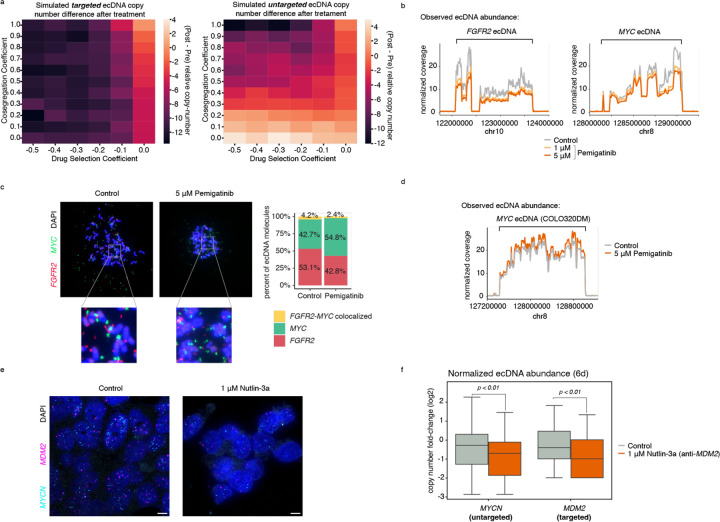
Extended Data Figure 8. Pemigatinib results in coordinated decreases in ecDNA copy numbers but not via oncogene fusion or direct targeting of MYC.
(a) Simulated changes in copy number after targeted treatment for the ecDNA directly or indirectly being targeted under various parameters of co-segregation and drug selection. 500,000 cells were simulated, and average values were reported across 10 replicates. (b) WGS coverage of FGFR2 and MYC ecDNA genomic intervals after 20 days of Pemigatinib treatment at 1 μM and 5 μM compared to PBS control. (c) Representative metaphase DNA FISH images showing distinct FGFR2 and MYC ecDNA species in SNU16m1 cells after 20 days of treatment with 5 μM Pemigatinib or PBS control (left), and quantification of distinct and colocalized FGFR2-MYC DNA FISH signals (right). (d) WGS coverage of MYC ecDNA genomic interval in COLO320DM cells after 20 days of treatment with 5 μM Pemigatinib compared to PBS control. (e) Representative images of DNA FISH on interphase TR14 cells with and without 1 μM Nutlin-3a treatment after 6 days. Scale bars are 5 µm. (f) Normalized copy number of MDM2 and MYCN in TR14 cells after 6 days of 1 μM Nutlin-3a or DMSO control treatment (p-values computed with a one-sided Wilcoxon rank-sums test). Boxplots show the quartiles of the distribution, and whiskers extend to 1.5x the interquantile range.

