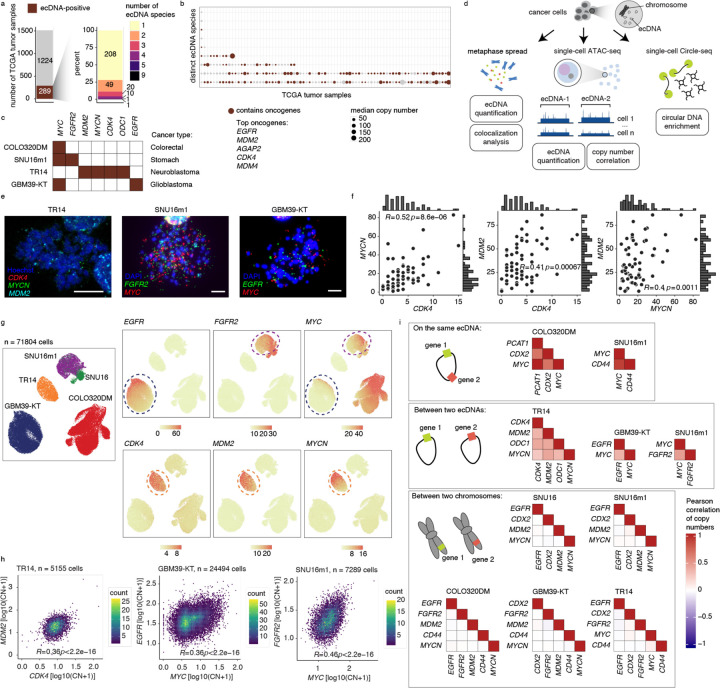
Figure 1. EcDNA species encoding distinct oncogene sequences are correlated in individual cancer cells.
(a) Summary of ecDNA-positive tumors (left) and number of ecDNA species (right) identified in TCGA tumor samples. (b) Median copy numbers and oncogene statuses of distinct ecDNA species in TCGA tumors identified to have more than one ecDNA species. (c) A panel of cell lines with known oncogene sequences on ecDNA. (d) Schematic of ecDNA analyses using three orthogonal approaches: metaphase spread, scATAC-seq, and scCircle-seq. (e) Representative DNA FISH images of metaphase spreads with FISH probes targeting various oncogene sequences as indicated. Scale bars are 10 µm. (f) Oncogene copy number scatter plots, histograms and Spearman correlations between pairs of oncogenes in TR14 cells. (g) UMAP from scATAC-seq showing cell line annotations (left) and copy number calculations of indicated oncogenes (right panels). (h) Density scatter plots of log-transformed oncogene copy numbers and Pearson correlations between pairs of oncogenes in the indicated cell lines. (i) Pearson correlation heatmaps of gene pairs on the same ecDNA (top), between two ecDNAs (middle), and between two chromosomes (bottom).

