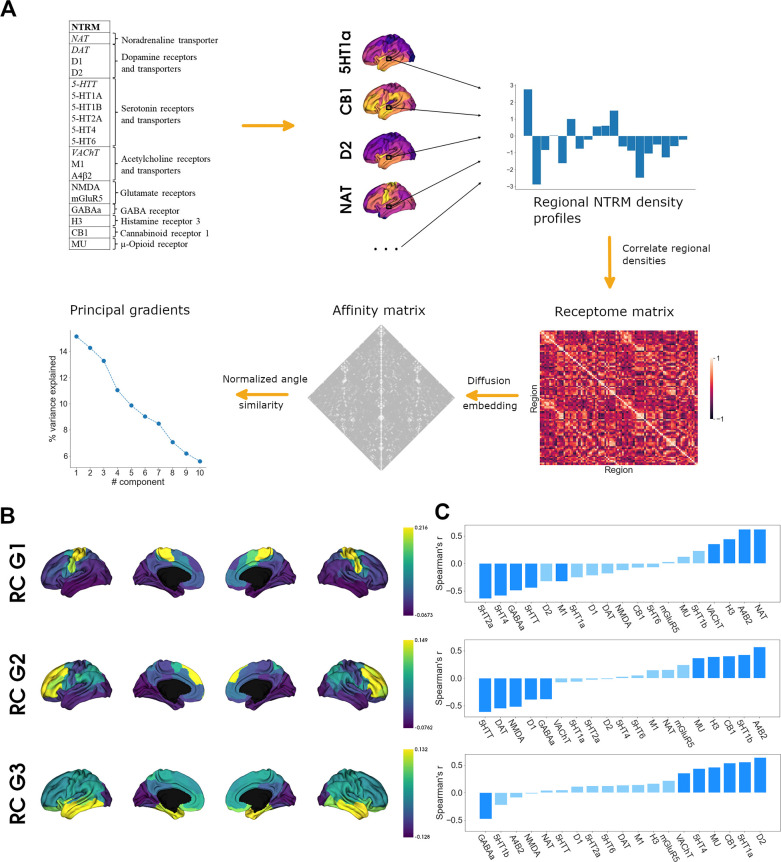
Figure 1. Organization of the cortical receptome.
(A) Analytic workflow of receptome generation and gradient decomposition. Node-level neurotransmitter receptor and transporter molecule (NTRM) fingerprints are derived from PET images of 19 different NTRM (in the top left, italic font denotes transporters). The fingerprints are then Spearman rank correlated to capture node-level similarity in chemoarchitectural composition, generating the receptome matrix. Next, to determine similarity between all rows of the receptome matrix, we used a normalized angle similarity kernel to generate an affinity matrix. Finally, we employ diffusion embedding, a nonlinear dimensionality reduction technique, to derive gradients of receptomic organization. (B) Receptome (RC) gradients projected on the cortical surface. Top: first receptome gradient (RC G1); middle: second receptome gradient (RC G2); bottom: third receptome gradient (RC G3). (C) Spearman rank correlations of cortical receptome gradients with individual NTRM densities. Top: first receptome gradient; middle: second receptome gradient; bottom: third receptome gradient. Saturated blue coloring corresponds to statistically significant correlations at p < 0.05.


