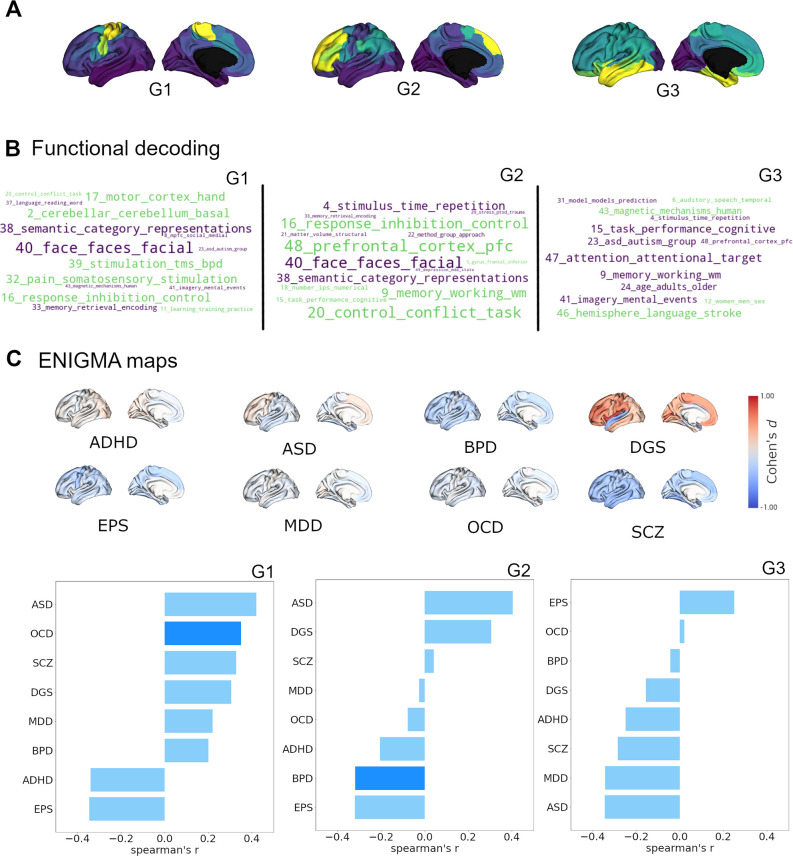
Figure 3. Cortical receptome gradients in term-based functional activation and disorder.
(A) Cortical receptome gradients projected to the cortical surface. (B) Functional decoding of cortical receptome gradients. Wordclouds display positive and negative correlations of receptome gradients and topic-based functional activation patterns. Word sizes encode absolute correlation strength, word colors are matched to the respective gradient poles. Only statistically significant correlations (p<0.05) are displayed. Left: RC G1; middle: RC G2; right: RC G3. (C) Disease decoding of cortical receptome gradients. Surface plots: effect size (Cohen’s d) of cortical thickness alterations in central nervous system disorders in patients vs. controls. Bar plots: Spearman rank correlations of receptome gradients and cortical thickness alterations. Saturated blue coloring corresponds to statistically significant correlations at p < 0.05. Left: RC G1; middle: RC G2; right: RC G3.

