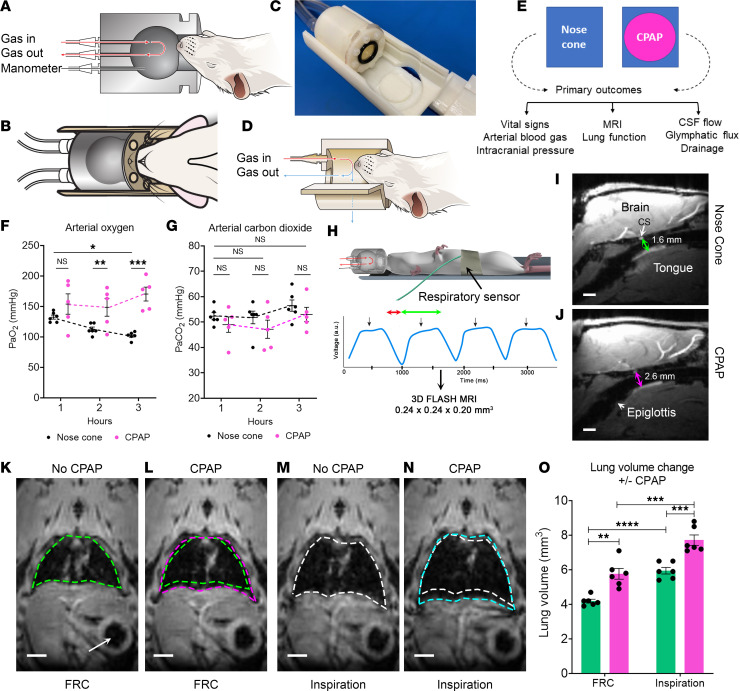
Figure 1. Nasal CPAP adapted for use in rats functions similarly to clinical CPAP.
(A–D) CPAP chamber and nose cone. (E) Overview of experiments. (F) Graph with arterial oxygenation values (PaO2) in rats breathing via the nose cone (n = 6, black dots) and CPAP (n = 5, pink dots). Each dot represents values from 1 rat. Data are shown as mean ± SEM. A linear mixed model with fixed effects of time (blood draw time), group (no CPAP vs. CPAP), and the interaction between time and group. *P = 0.029, **P = 0.028, ***P < 0.001. (G) Corresponding graph with arterial carbon dioxide (PaCO2) values. (H) Overview of experimental design for lung studies. The inhalation and exhalation phases are indicated with a red and green arrow, respectively. Black arrows indicate respiratory triggers. FLASH, fast low angle shot sequence. (I and J) Anatomical MRIs in the midbrain sagittal-view plane, which captures the upper airway anatomy including the tongue, epiglottis, and trachea. Arrows represent distance from the cavernous sinus (CS, white arrow) to the base of the tongue in a rat breathing via the nose cone (green arrow, distance = 1.6 mm) and with CPAP (pink arrow, distance = 2.6 mm). Scale bar = 3 mm. (K and L) Outline of the lungs at end expiration (functional residual capacity, FRC) without (green contour) or with CPAP (pink contour). (M and N) Corresponding MRI images acquired at peak inspiration with and without CPAP. The arrow in K points to the stomach. Scale bars = 500 μm. (O) Graph with values of FRC and inspiratory lung volumes from 6 rats where the rats served as their own controls, obtained with no CPAP (green bars) and with CPAP (pink bars). Data are mean ± SEM. A linear mixed models with fixed effects of time (respiratory cycle, i.e., end expiration and inspiration), group (no CPAP vs. CPAP), and the interaction between respiratory cycle and group. **P = 0.003, ***P = 0.001, ****P < 0.001.

