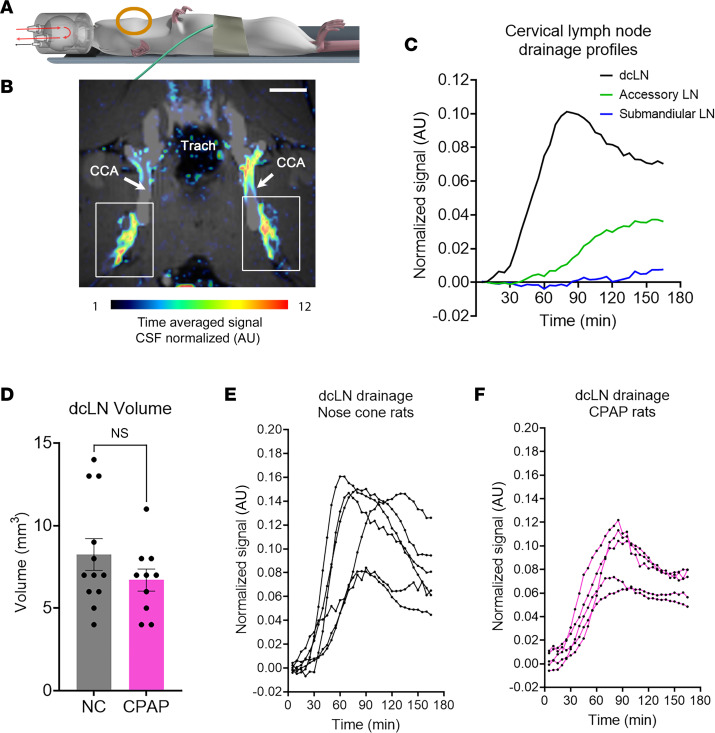
Figure 4. CPAP sustains drainage to the cervical lymph nodes.
(A) Illustration of the radiofrequency (RF) surface coil positioned above the neck of the rat in supine position while breathing with CPAP. (B) Anatomical MRI image at the level of the deep cervical lymph nodes (dcLN, white boxes) overlaid with corresponding solute drainage map represented by color coded signal intensity normalized to the CSF signal and time-averaged over approximately 2 hours. Scale bars = 2.5 mm. Trach, trachea; CCA, common carotid artery. (C) Time signal curves of tracer uptake in dcLNs (shown in black), accessory lymph nodes (green), and submandibular lymph nodes (blue) from a normal rat. (D) Volumes of the dcLNs extracted from rats breathing via the nose cone (gray bar) or CPAP set at 3 cmH2O (pink bar). Each dot above the bars represents values from 1 dcLN with 2 dcLNs/rat. Data are mean ± SEM. An independent 2-sided t test was used and revealed no differences in dcLN volume across the 2 groups (P = 0.2016). (E) Time signal curves (TSC) from the dcLNs of each rat derived from independent experiments of n = 6 rats breathing via the nose cone. Each line represents average signal change of the right- or left-sided dcLNs from each rat. (F) Corresponding TSC data extracted from dcLNs derived from independent experiments of n = 5 rats breathing with CPAP set at 3 cmH2O.

