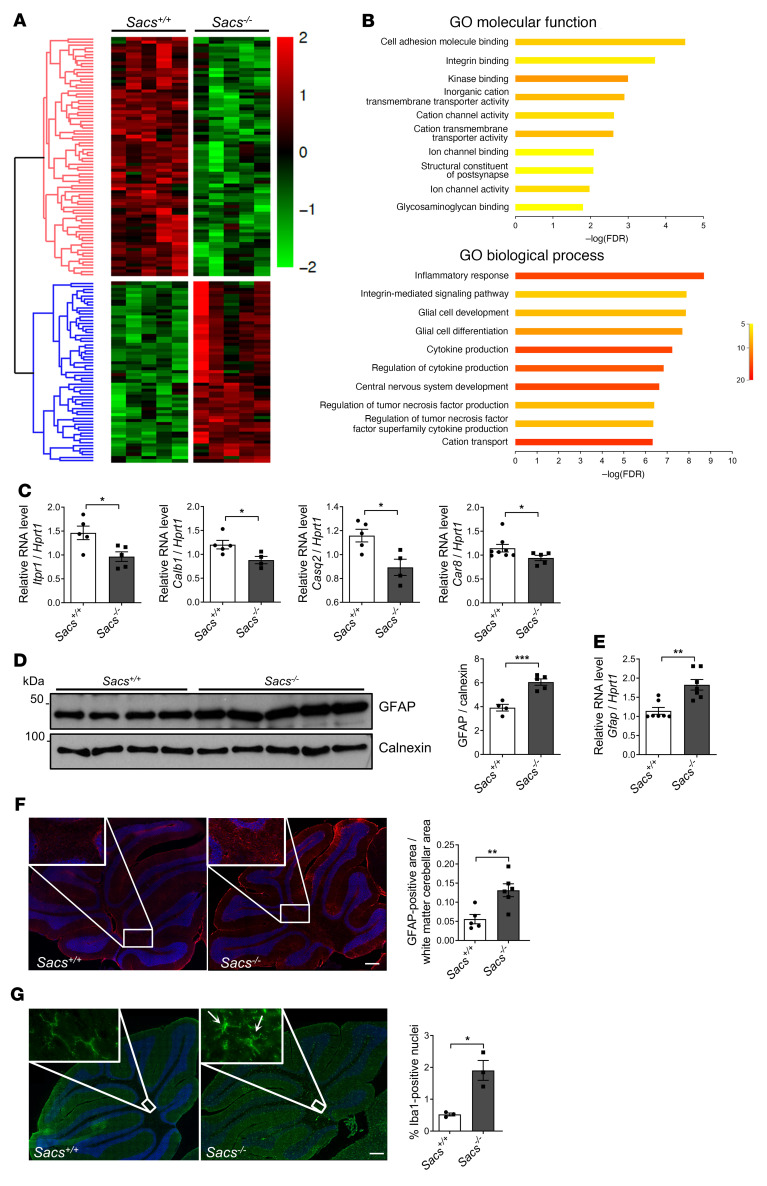
Figure 5. Transcriptomics analysis supports Ca2+ deregulation and neuroinflammation in Sacs–/– cerebellum.
(A) Heatmap of cerebellar gene expression profile comparing Sacs–/– and WT mice at 5 months of age; n = 5. (B) g:Profiler enrichment of deregulated genes comparing 5-month-old Sacs–/– and WT cerebellum showing the top 10 categories for each GO: molecular function and biological process. Color bar represents number of genes. (C) qPCR showing levels of Itpr1, Calb1, Casq2, and Car8 mRNA (relative to Hprt1 mRNA) in Sacs–/– and WT cerebellum at 5 months of age. Data are shown as mean ± SEM; n = 5; Welch’s t test. * P < 0.05. (D) WB analysis showing levels of GFAP in Sacs–/– and WT control cerebellum at 5 months of age with relative quantitation (normalized to calnexin). Data are shown as mean ± SEM; n = at least 4; Welch’s t test. ***P < 0.001. (E) qPCR showing levels of Gfap mRNA (relative to Hprt1 mRNA) in Sacs–/– and control cerebellum at 5 months of age. Data are shown as mean ± SEM; n = 5; Welch’s t test. **P < 0.01. (F) Representative images of immunofluorescence analysis showing astrocyte activation (GFAP, in red) in 5-month-old Sacs–/– cerebellum compared with controls. Scale bar: 0.2 mm. Data are shown as mean ± SEM; n = 3; Welch’s t test. **P < 0.01. (G) Representative images of immunofluorescence staining of microglia by Iba1 (in green) highlighting microglial morphological shift in 5-month-old Sacs–/– cerebellum compared with WT controls. Arrows indicate the amoeboid-phagocytic phenotype of microglia. Quantitative analysis of the percentage of Iba1+ cells was normalized to the total nuclei number. Scale bar: 0.2 mm. Data are shown as mean ± SEM; n = 3; Welch’s t test. *P < 0.05.

