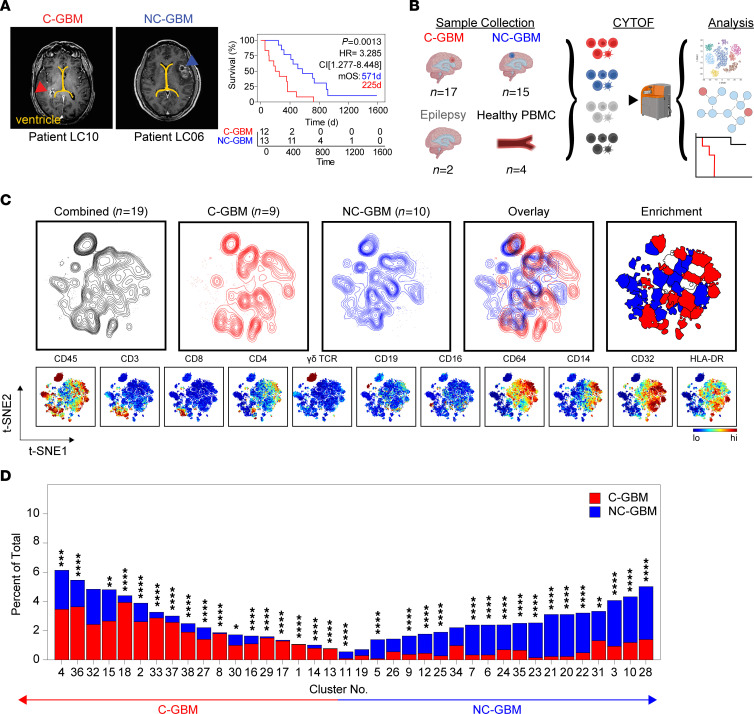
Figure 1. LV-contacting and -noncontacting GBMs are enriched in distinct immune subsets.
(A) Representative MRI radiographs of GBM tumors with confirmed contact with either of the LVs (left, C-GBM) or lacking ventricular involvement (right, NC-GBM). Yellow line indicates the LV. Arrows indicate the tumor mass. Kaplan-Meier curve indicates the survival proportion in patients with C-GBM (n = 12) and NC-GBM (n = 13). (B) Schematic of experimental workflow. (C) Live CD45+ cells were combined from all patients (black contour, n = 19), C-GBM tumors only (red contour, n = 9), or NC-GBM tumors only (blue contour, n = 10). Overlaid t-SNE plots indicate areas of immune infiltration unique to patients with tumor subtype. Enrichment indicates which computationally gated immune populations were statistically enriched in C-GBM or NC-GBM. Heatmaps displayed for chosen markers indicate major immune subsets. (D) Bar graphs demonstrating the frequency of immune cells found within each computational cluster as a percentage of total CD45+ leukocytes. Statistical significance was calculated using a χ2 test. * = P < 0.05, ** = P < 0.01, *** = P < 0.001, **** = P < 0.0001.

