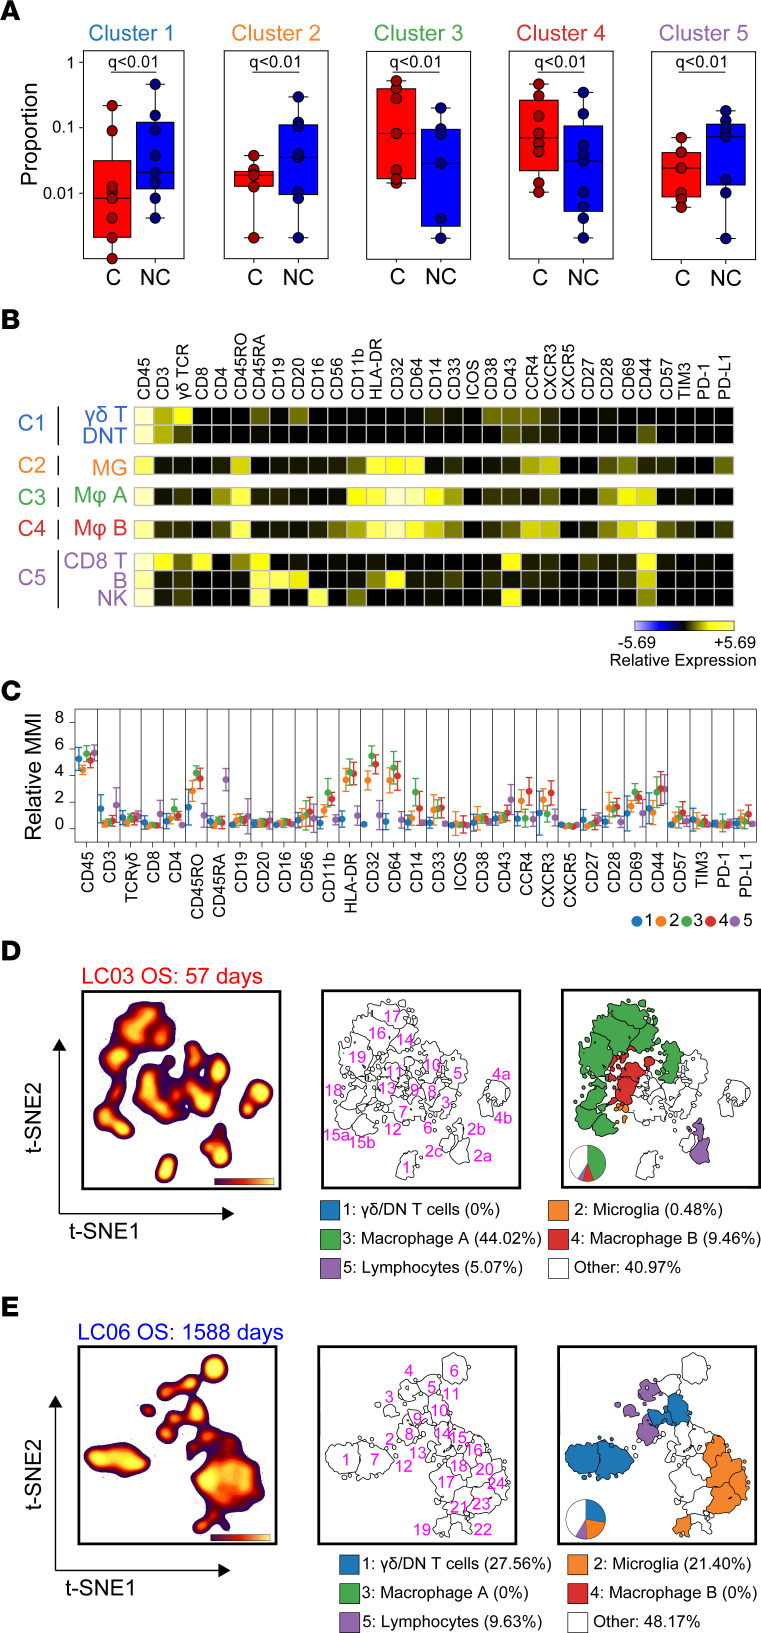
Figure 2. Differential enrichment of 5 immune phenotypes distinguish ventricle-contacting and -noncontacting GBM.
(A) Citrus clustering of live CD45+ leukocytes in the tumor microenvironment of C-GBM and NC-GBM tumors revealed differential enrichment of 5 immune subsets. (B) Heatmaps of each phenotypic marker used to classify each immune subset reveal the expression levels of each immune receptor. (C) Quantification of the arcsinh-transformed expression level of each immune marker within each subset. MMI, median mass intensity. Representative t-SNE plot of all CD45+ leukocytes infiltrating a C-GBM tumor (D) or NC-GBM tumor (E). Cell density (left), FlowSOM clustering on the t-SNE axes (middle), and Citrus overlay and quantification (right) determined the relative frequency of each immune cell subset within each patient sample. In A, a regularized regression model in the Citrus analysis identified stratifying clusters (19 patients: 9 C-GBM, 10 NC-GBM). Predictive analysis of microarrays–stratified (PAM-stratified) immune clusters. An FDR < 1% (q) determined significance in all instances.

