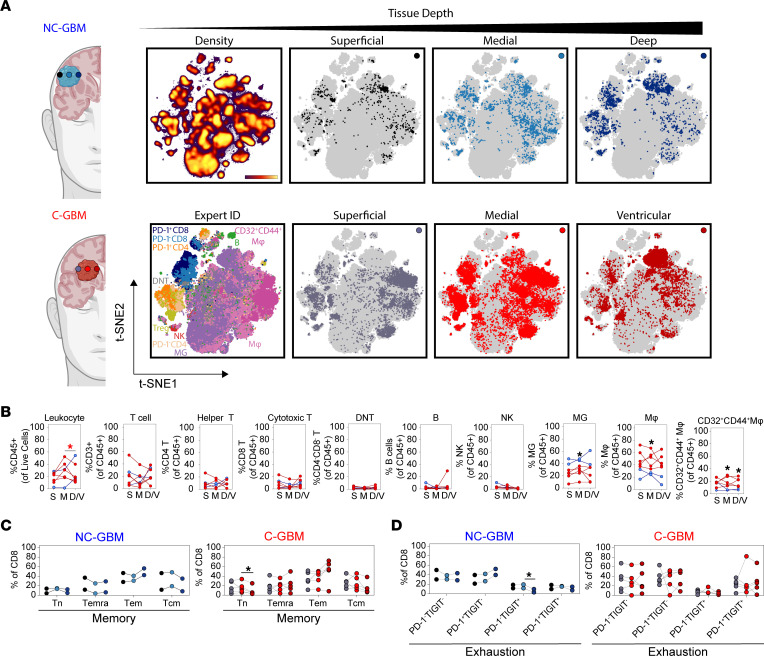
Figure 5. Enrichment of CD32+CD44+ macrophages proximal to the LV.
(A) Representative t-SNE plots indicating the CD45+ leukocyte fraction infiltrating focal subregions biopsied from the bulk tumor mass of patients with NC-GBM (n = 2) or C-GBM (n = 5). Paired biopsies were collected from 1) superficial (black/gray), 2) medial (light blue/light red), or 3) deepest region available to safe surgical resection (dark blue/dark red). (B) The frequency of each indicated immune subset was calculated as a fraction of the total cell fraction in the biopsy (leukocytes) or as a fraction of the total leukocyte pool in each sample. S, superficial tumor tissue; M, medial tumor tissue; D/V, deep/ventricular tumor tissue. (C) Frequency of memory CD8+ T cell populations within subregions from NC-GBM (blue) or C-GBM (red). Tn, naive T; Temra, effector memory CD45RA+; Tem, effector memory; Tcm, central memory. (D) Frequency of exhausted CD8+ T cell populations within tumor subregions. Each line in B–D represents 1 paired patient sample. One-way ANOVA with Tukey’s multiple comparisons test calculated statistical significance. * = P < 0.05.

