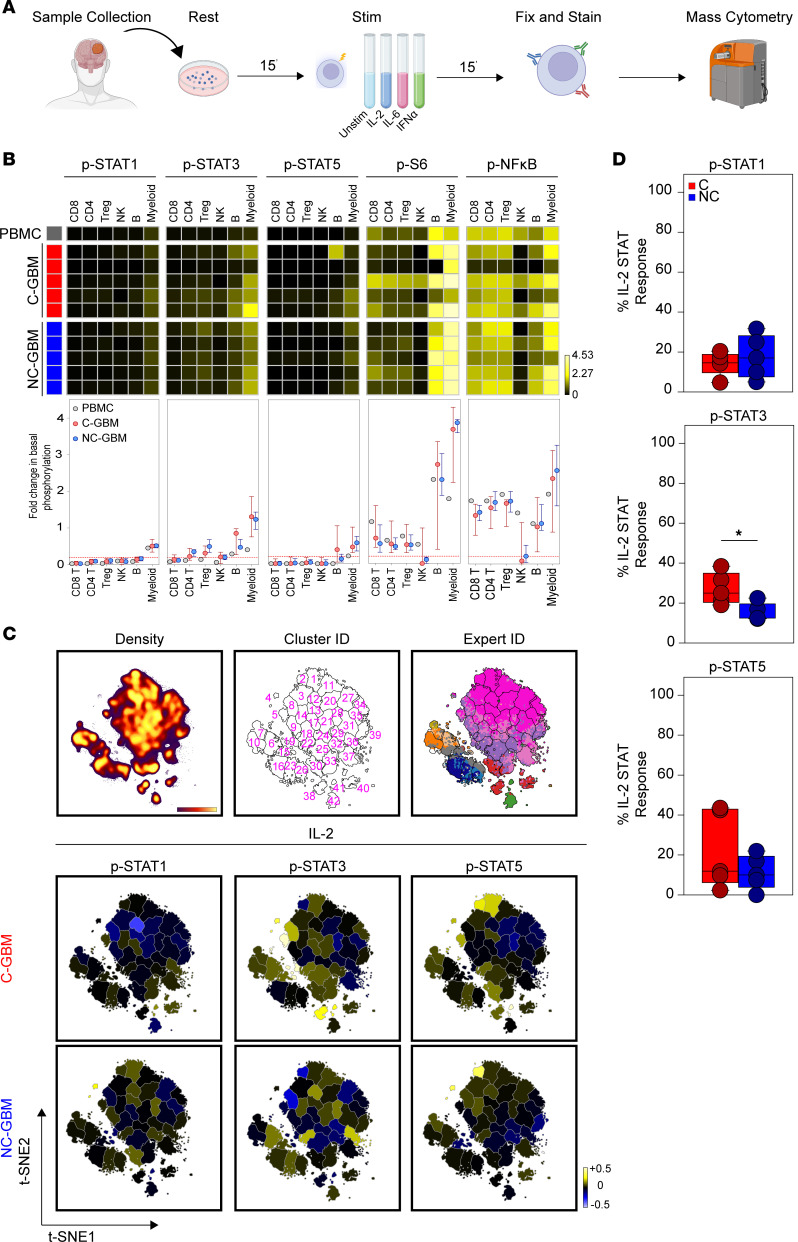
Figure 6. Immune cells infiltrating GBM tumors are functional and responsive to cytokine stimulation.
(A) Schema of cytokine stimulation and phospho-protein readouts. (B) Heatmaps indicating the arcsinh fold-transformed median intensity values of each indicated phospho-protein within each manually gated immune subset in healthy donor PBMCs (gray, n = 1), C-GBM tumors (red, n = 5), or NC-GBM tumors (blue, n = 5). Graphs below the heatmaps indicate the median ± IQR for each indicated immune population and phospho-protein readout. (C) Representative t-SNE plot indicating the density of CD45+ leukocytes (left), enumerated FlowSOM clusters (middle), and overlay of expert-gated immune populations onto the clustered t-SNE axes (right) pooled from n = 10 patients. Representative heatmaps on the t-SNE axes indicate the cluster-specific median arcsinh fold-change of the indicated phospho-protein under IL-2 stimulation conditions compared with basal phosphorylation. (D) Box-and-whisker plots indicating the proportion of clusters in C-GBM or NC-GBM immune infiltrates surpassing the phospho-signaling threshold (>0.2 arcsinh fold-change) in response to IL-2 stimulation. Box-and-whisker plots indicate the median ± IQR.

