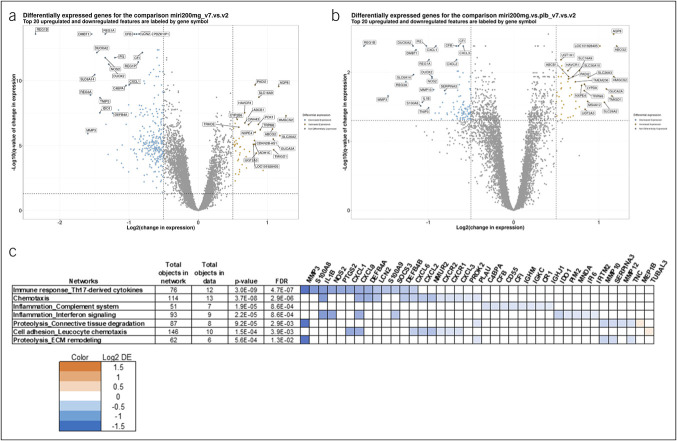
Figure 1.
Differentially expressed genes after mirikizumab treatment. (a, b) Differentially expressed (log2 fold change ≥0.5 and false discovery rate [FDR] ≤0.05) genes in the 200 mg mirikizumab group before (a) and after (b) normalizing for placebo are shown as blue circles if decreased and orange circles if increased. The 20 most increased and decreased are labeled. (c) The most differentially expressed genes in the 200 mg mirikizumab group, after normalizing for placebo, grouped by gene networks as defined by the MetaCore database (Clarivate Analytics, Philadelphia, PA).

