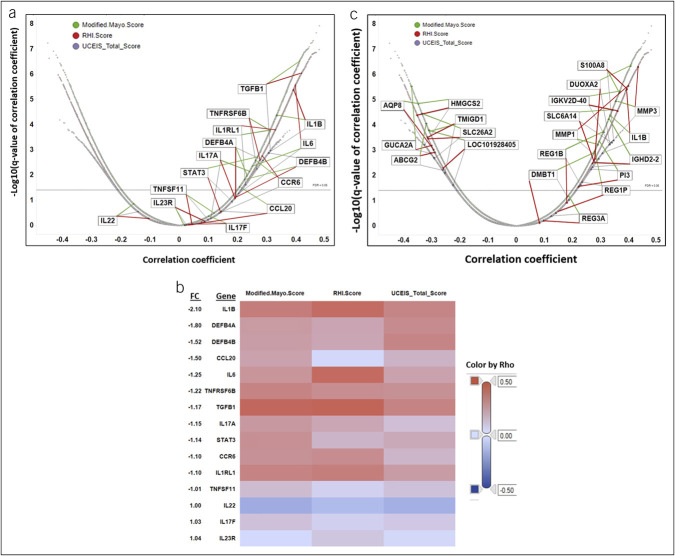
Figure 2.
Correlation between IL-23 pathway transcripts and changes in disease activity scores. (a) Pearson correlation coefficients for the differential expression of mirikizumab-regulated genes at week 12 with change over the same period in modified Mayo score (green), RHI (red), and UCEIS (gray). Genes that are identified by the MetaCore database (Clarivate Analytics, Philadelphia, PA) as being upregulated by IL-23 are labeled. (b) Heat map of Pearson correlation coefficients (Rho) for the differential expression of each gene identified above. Fold change values for each gene in the 200 mg mirikizumab dose group after normalization with the change in the placebo group are labeled on the vertical axis. (c) Correlation between changes in mirikizumab-regulated genes and changes in disease activity scores. Pearson correlation coefficients for the differential expression of mirikizumab-regulated genes at week 12 with change over the same period in modified Mayo score (green), RHI (red), and UCEIS (gray). Genes with a differential expression of ≥2-fold in the 200 mg mirikizumab dose group after normalization with change in the placebo group are labeled. All labeled genes that were positively correlated with changes in disease activity scores decreased between baseline and week 12, and those that were negatively correlated with changes in disease activity scores increased in expression over that period. RHI, Robarts Histopathology Index; UCEIS, Ulcerative Colitis Endoscopic Index of Severity.

