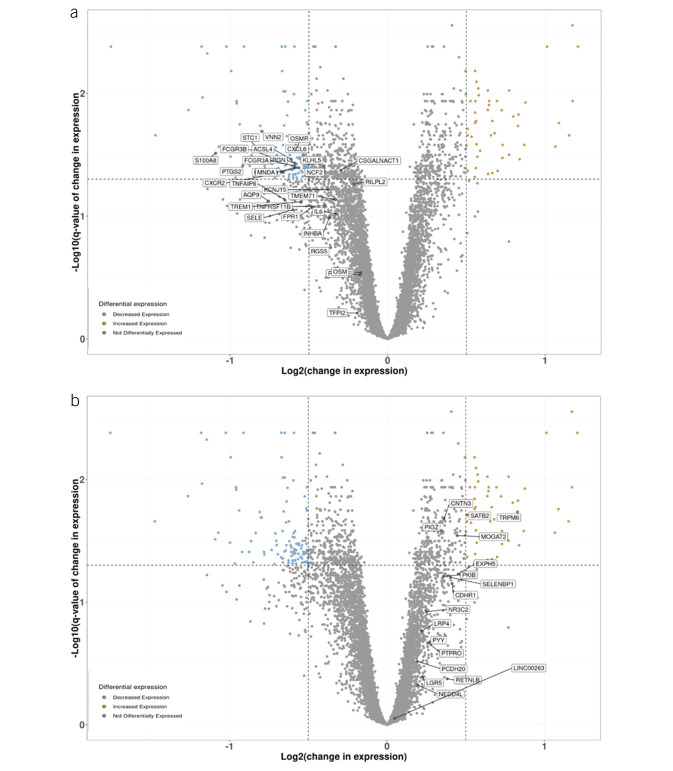
Figure 3.
Mirikizumab-regulated genes associated with anti-TNF inhibitor resistance and response. Change in expression of each gene in the 200 mg mirikizumab dose group between baseline and week 12 normalized for change in expression in the placebo group over the same period. Differentially expressed genes (log2 fold change ≥0.5 and false discovery rate ≤0.05) are shown with blue circles if decreased and orange circles if increased. Genes associated with resistance (a) and response (b) to anti-TNF inhibitor treatment are labeled. TNF, tumor necrosis factor.

