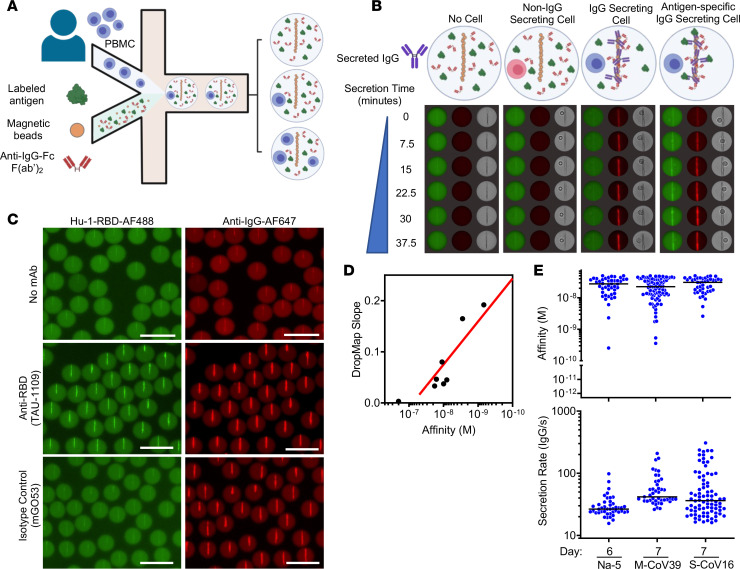
Figure 1. DropMap technique for the detection of anti–Hu-1 IgG–secreting cells.
(A) Schematic showing the inputs and outputs of microfluidic encapsulation. PBMCs (top) are flowed in parallel with bioassay components (RBD–Alexa Fluor 488, magnetic beads coated with anti–κ light chain nanobody (VHH), and anti-IgG F(ab′)2–Alexa Fluor 647) on the droplet nozzle. Oil flow closes the collected aqueous phases (cell component and bioassay component) into a water-in-oil droplet. The column of droplets depicts the potential outcomes of cell encapsulation. (B) Schematic showing the composition of the DropMap assay and potential changes to the assay as it progresses. In the absence of a cell (outer left) or with a non–IgG-SC (inner left), there is no change in RBD (green) or anti–IgG F(ab′)2 (red) fluorescence distributions over time. An IgG-SC (inner right) in the droplet causes anti–IgG F(ab′)2 (red) fluorescence to relocate to the beadline over time. An RBD-specific IgG-SC (outer right) causes both RBD (green) and anti–IgG F(ab′)2 (red) fluorescence to relocate to the beadline. (C) Example of droplets containing no mAb (top), 5 nM TAU-1109 anti-RBD mAb (center), or 5 nM isotype control IgG (clone mGO53, bottom), showing fluorescence relocation of Hu-1 RBD–Alexa Fluor 488 (green, left) and anti–IgG F(ab′)2–Alexa Fluor 647 (red, right). Scale bars: 50 μm. (D) Hu-1 RBD affinity reference curve calibrated with anti-RBD mAbs with known KD and DropMap slope determined from methods exampled in (Supplemental Figure 1B). Each dot represents the values for 1 mAb or isotype control. (E) Representative examples of anti-RBD antibody affinity (top) and IgG secretion (bottom) by circulating, single IgG-SCs (n = 171) from indicated individuals; each dot represents 1 IgG-SC; black bars indicate median values.

