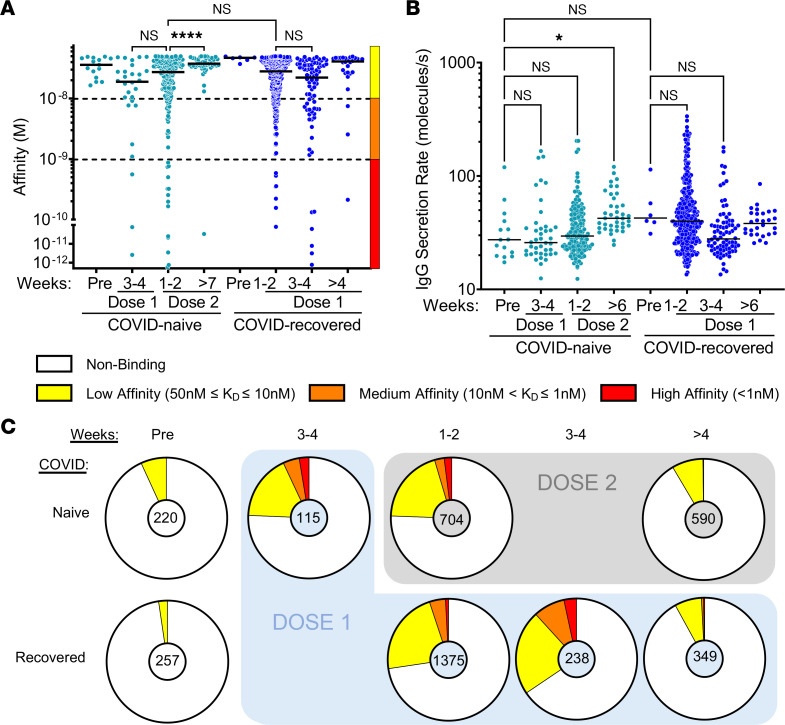
Figure 2. Anti–Hu-1 RBD IgG-SC responses following vaccination.
(A and B) (A) Affinities for SARS-CoV-2 Hu-1 RBD and (B) secretion rates of a single IgG-SC (n = 762) from pooled vaccinee data, with naive and recovered individuals shown in light blue and dark blue, respectively. Each dot represents a value from a single cell. Medians are shown. NS, nonsignificant. *P < 0.05; ****P < 0.0001 using Kruskal-Wallis test with Dunn’s test for multiple comparisons. Affinities are grouped as low (yellow), medium (orange), and high (red) affinity, shown by the bar on the right and separated by the dotted lines. (C) Frequencies of RBD-specific IgG-SCs classified into low (yellow), medium (orange), high affinity (red), or no detectable binding (white), among total IgG-SCs (total numbers indicated in center).

