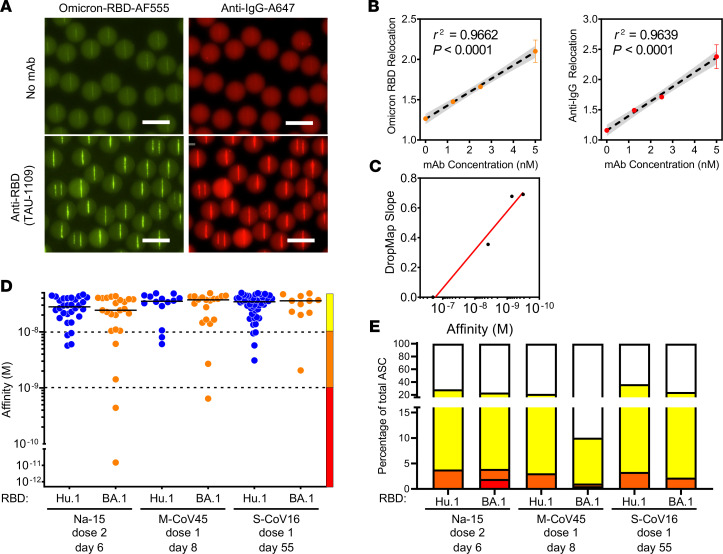
Figure 3. DropMap for the detection of anti-BA.1 IgG–secreting cells.
(A) Example of droplets containing no mAb (top) or 5 nM TAU-1109 mAb (bottom), showing fluorescence relocation of Omicron BA.1 RBD–Alexa Fluor 555 (yellow, left) and anti–IgG F(ab′)2–Alexa Fluor 647 (red, right). Scale bars: 50 μm. (B) In-droplet mAb (TAU-1109) measurement of fluorescence relocation at 0, 1.25, 2.5, and 5 nM in droplet concentration performed in triplicate. Each dot represents the mean of a triplicate measure. Linear regression is represented, with 95% confidence intervals in gray, n = 3. (C) Omicron affinity reference curve calibrated with anti-RBD mAbs with known KD for BA.1 RBD and DropMap slope determined from method exemplified in B. (D) Affinities for SARS-CoV-2 RBD of a single IgG-SC (n = 181) from naive and recovered individuals using either Hu-1 (blue) or BA.1 (orange) RBD. Each dot represents a value from a single cell. Medians are shown. (E) Frequencies of Hu-1–specific (top) or BA.1-specific (bottom) IgG-SCs classified into low (yellow), medium (orange), high affinity (red), or no detectable binding (white), among total IgG-SCs, with total numbers indicated in center.

