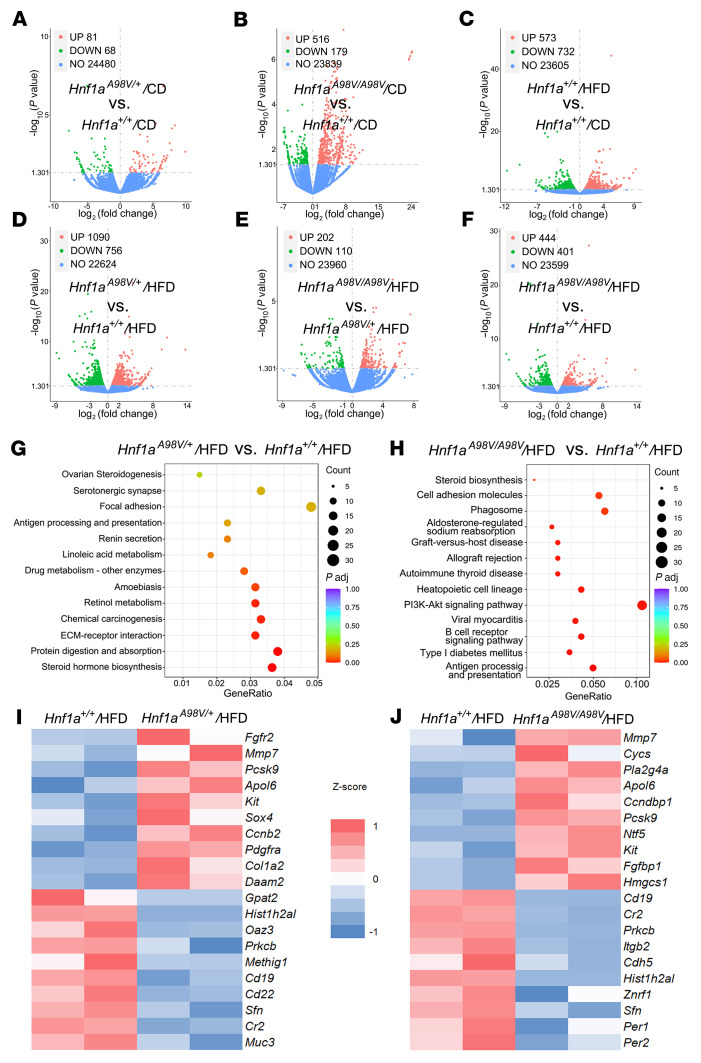
Figure 3. HNF1AA98V with HFD showed altered pathways in immune function and energy metabolism.
(A–F) Volcano plots of differential expression analysis for the indicated genotypes on control chow or HFD. (G and H) KEGG pathway enrichment of significant DEGs. (I and J) Heatmaps of cholesterol/lipid biosynthetic genes depicting representative differential gene expression between groups.

