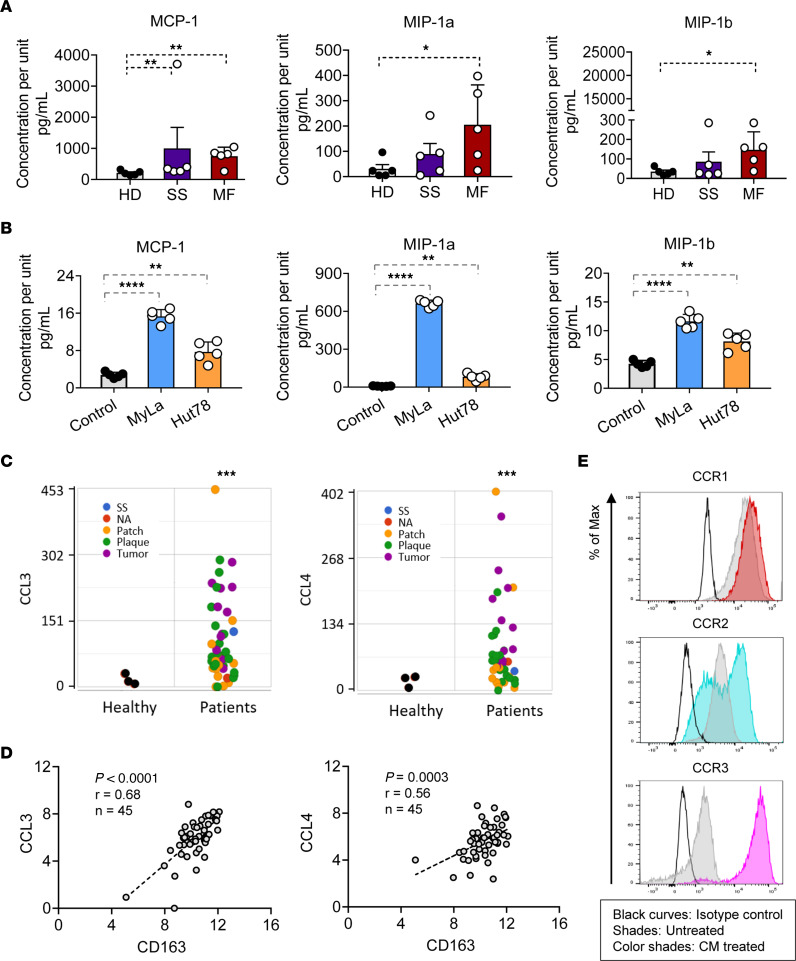
Figure 3. Increased levels of chemokines CCL2, CCL3, and CCL4 in patients with CTCL correlate with M2-like TAMs.
(A) The concentrations of MCP-1 (CCL2), MIP-1α (CCL3), and MIP-1β (CCL4) in plasma samples (n = 5) compared with HD (n = 5). (B) The concentrations of MCP-1, MIP-1α, and MIP-1β in MyLa (n = 5) and Hut78 (n = 5) supernatant compared with blank culture medium. Data are representative of 3 independent experiments with mean ± SD for A and B. Significant difference was determined by 1-way ANOVA and P ≤ 0.05 was considered significant. *P < 0.05; **P < 0.01; ****P < 0.0001. (C) RNA-Seq gene-level analysis plots indicate the expression levels of CCL3 and CCL4 genes in CTCL (n = 45) and normal controls (n = 3). Data are representative of 3 independent experiments. The green dots indicate plaque, yellow dots show patch, purple dots show tumor, blue dots represent SS, and black dots represent normal. ***P < 0.001, by 2-tailed Student’s t test. (D) Lesional CTCL skin RNA-Seq gene expression levels of CCL3 and CCL4 positively correlated with CD163 (n = 45). Data are representative of 3 independent experiments. The Spearman’s correlation coefficient was determined (r = 0.68, P < 0.0001; r = 0.56, P < 0.0003). (E) The expression levels of CCR1, CCR2, and CCR5 were detected on macrophages induced by CTCL cell line supernatant using flow cytometry. The histograms were representative of 3 independent experiments. The black curves represent the fluorescence intensity of the isotype control, shades represent the fluorescence intensity of untreated, and color lines represent the fluorescence intensity of CM treated.

