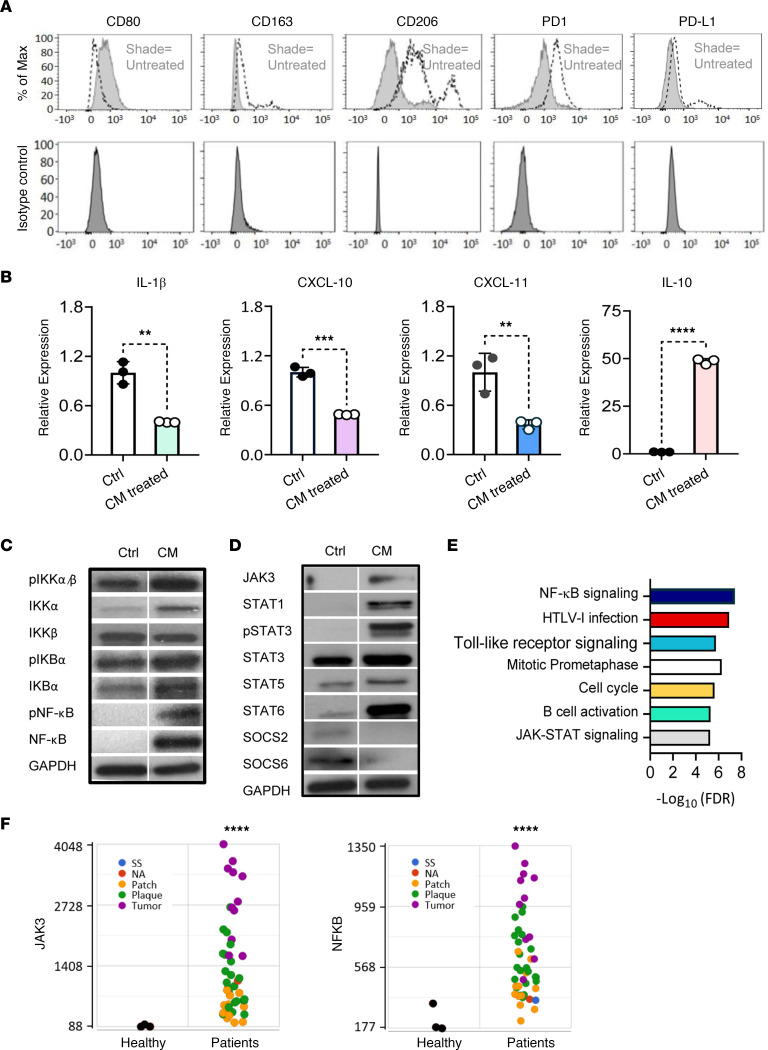
Figure 4. CTCL cell line supernatant induces PD-1+ M2-like TAMs in vitro.
Healthy CD14+ monocytes were cultured for 72 hours in CTCL cell line–conditioned medium. (A) The expression of CD80, CD163, CD206, PD-1, and PD-L1 was detected in TAMs induced by CTCL cell line supernatant using flow cytometry. The histograms were representative of 3 independent experiments. The lighter shades at the top represent the fluorescence intensity of the untreated controls, and the darker shades at the bottom represent the fluorescence intensity of the isotype controls. (B) IL-1β, CXCL-10, CXCL-11, and IL-10 mRNA levels were assessed in total CD14+ cells cultured with or without CTCL cell line supernatant. Data are presented as mean ± SD from 3 biological replicates. **P < 0.01, ***P < 0.001, ****P < 0.0001, by 2-tailed Student’s t test. (C) Protein expression of p-IKKα/β, IKKα, IKKβ, p–NF-κB, IKBα, p-IKBα, and NF-κB and (D) JAK3, STATs, and SOCSs in lysates from TAMs induced by CM compared with expression from monocytes without CM assessed by Western blotting using GAPDH as a loading control (Ctrl, control; CM, CTCL cell line supernatant). One representative image of 3 independent samples per group is shown. (E) The hallmark pathway analysis of differentially expressed genes in CTCL (n = 45) as compared with healthy controls (n = 45). Data are representative of 3 independent experiments. For each pathway shown, the difference between groups had an FDR q value less than 0.05. (F) RNA-Seq gene-level analysis plots reveal the expression levels of JAK3 and NF-κB genes in CTCL (n = 45) and healthy controls (n = 3). The green dots indicate plaque, yellow dots indicate patch, purple dots represent tumor, blue dots show SS, and black dots show normal. Data are representative of 3 independent experiments. ****P < 0.0001, by 2-tailed Student’s t test.

