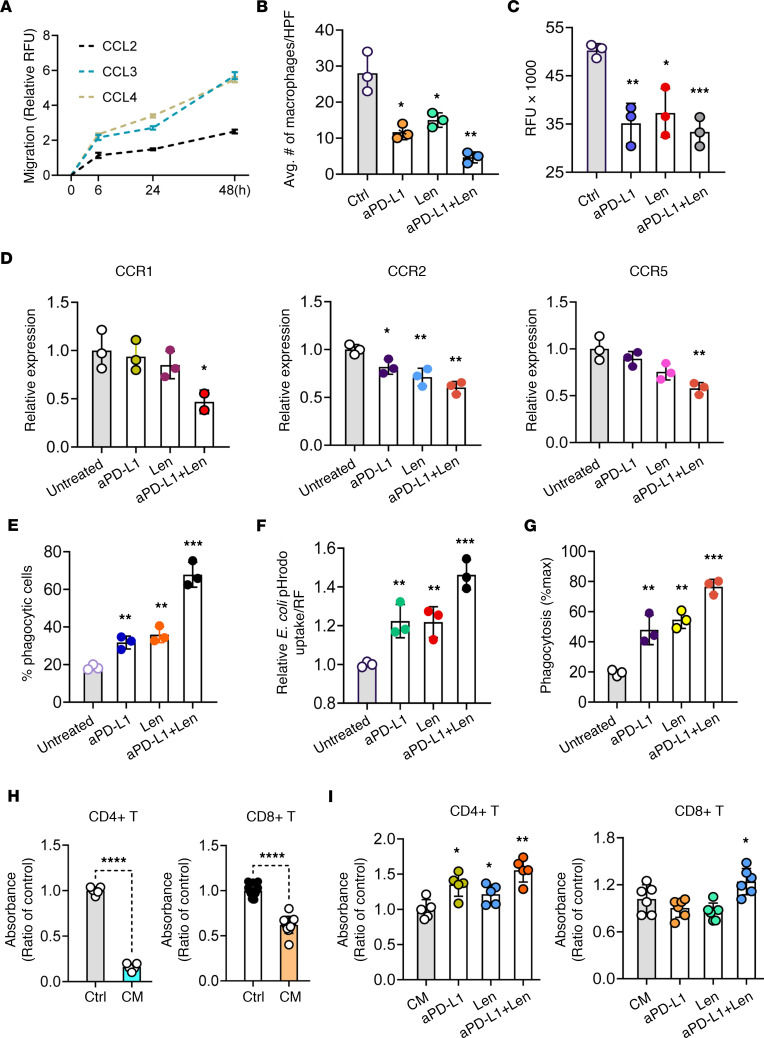
Figure 6. Functional changes of M2-like TAMs after lenalidomide and anti–PD-L1 Ab treatment.
(A) M2-like TAMs were exposed to CCL2, CCL3, and CCL4 for 6, 24, and 48 hours; migration was determined by QCM 24-well Cell Migration assay (n = 3). (B) Transwell migration assays were performed on CTCL cell line supernatant-induced TAMs that were untreated or treated with anti–PD-L1, lenalidomide, or their combination (n = 3). (C) The migration ability of CTCL cell line supernatant-induced TAMs in the same treatment conditions as in B were quantified by QCM 24-well Cell Migration assay (n = 3). (D) The expression levels of chemokine receptors were shown for M2-like TAMs before and after treatment (n = 3). (E) CTCL cell line supernatant-induced TAMs in the same treatment conditions as in B were incubated for 2 hours with fluorescent polystyrene latex beads (n = 3). (F) CTCL cell line supernatant-induced TAMs in the same treatment conditions as above were incubated with E. coli for 45 minutes. Uptake of pHrodo Green E. coli BioParticles Conjugate was analyzed using flow cytometry (n = 3). (G) A phagocytosis assay with M2-like TAMs showing that anti–PD-L1 and lenalidomide treatment enhanced phagocytosis of cancer cells (n = 3). (H) CD4+ or CD8+ T cell proliferations were assessed when they were cocultured with CTCL cell line supernatant-induced TAMs using the MTT assay. ****P < 0.0001 by 2-tailed Student’s t test. (I) MTT assay was performed for CD4+ and CD8+ T cell proliferation upon coculture with MyLa-supernatant induced TAMs in the same treatment conditions as above. B–I, each value is the mean ± SD of 3 independent experiments. H and I (CD4+ T, n = 5; CD8+ T, n = 6). For B–G and I, significant difference was determined by 1-way ANOVA and P ≤ 0.05 was considered significant. *P < 0.05; **P < 0.01; ***P < 0.001.

