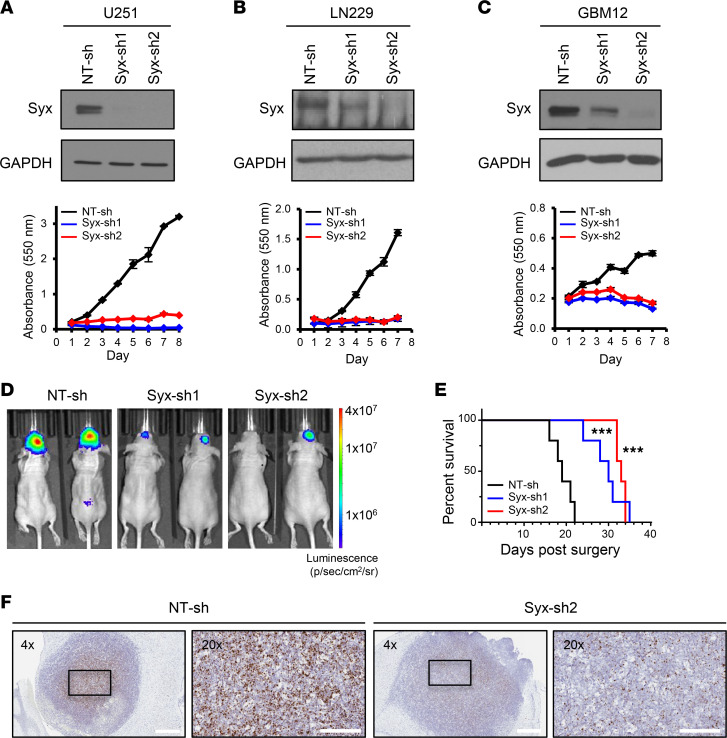
Figure 1. Depletion of Syx decreases GBM cell growth.
(A–C) Immunoblot analysis of Syx and GAPDH in lysates from GBM conventional — U251 (A), LN229 (B) — and PDX —GBM12 (C) — cell lines transduced with indicated shRNAs (top). The same samples are shown with equal loading amounts run at different times (A) or in parallel (B). Cell viability over indicated time for each cell population was measured by the MTT assay (bottom). Shown are representative graphs with 3 technical replicates of 3–5 biological repeats. Graphs represent the mean ± SD. (D) Representative images of brain bioluminescence on day 19 after transplantation from intracranial xenografts derived from GBM12 cells expressing indicated shRNAs in immunocompromised mice. Luminescence in photons/sec/cm2/steradian units. (E) Kaplan-Meier survival curves of mice orthotopically transplanted with GBM12 cells transduced with indicated shRNAs. n = 5 mice per group. Log-rank test (***P < 0.001 for either Syx-sh1 or Syx-sh2 compared with NT-sh). (F) Expression of human Syx transcripts detected by RNAscope in situ hybridization in GBM12-derived xenografts expressing indicated shRNAs. Scale bar: 600 μm (4×), 200 μm (20×).

