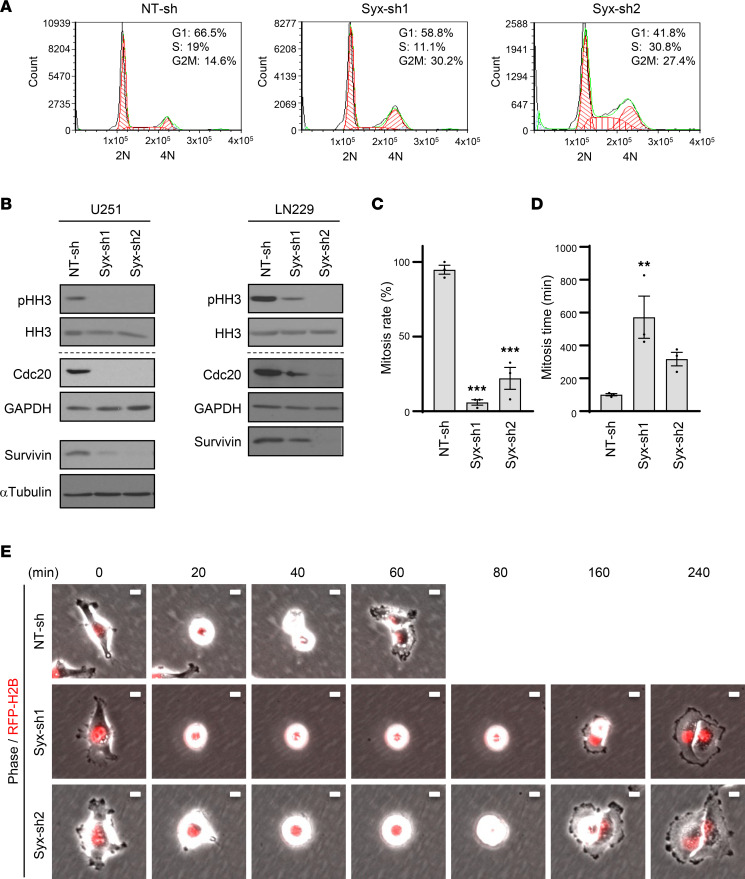
Figure 2. Syx is required for GBM cell cycle progression and mitosis.
(A) Representative DNA fluorescence histograms and percentages of cells at different cell cycle phases (n = 3 biological repeats), as determined by propidium iodide-based DNA cell cycle analysis. DNA content (2n, 4n) is indicated. (B) Immunoblot analysis of mitotic markers (phosphorylated histone H3 at Ser10, pHH3), total histone 3 (HH3), and mitotic regulators (Cdc20, Survivin) in lysates of GBM cells (U251, LN229) expressing indicated shRNAs. Different biological samples are separated by dashed lines. The same biological samples run at different times are indicated by larger white space. pHH3 and HH3 blots were run in parallel. Survivin, Cdc20, and GAPDH were run in parallel (LN229). (C–E) Cell division was visualized and analyzed by 24-hour time-lapse imaging of U251 cells expressing indicated shRNAs and RFP-H2B. (C) Percentage of cells with successful cell division in each group (n > 100 cells per group). (D) The duration of mitosis (mitosis time) of cells that successfully underwent mitosis. Graphs (C and D) represent the mean ± SEM of 3 biological repeats. One-way ANOVA with Dunnett’s multiple-comparison test. **P < 0.01, ***P < 0.001. (E) Representative images (n = 3 experiments) of cells undergoing mitosis, acquired by time-lapse microscopy (time in minutes indicated above). Scale bar: 10 μm.

