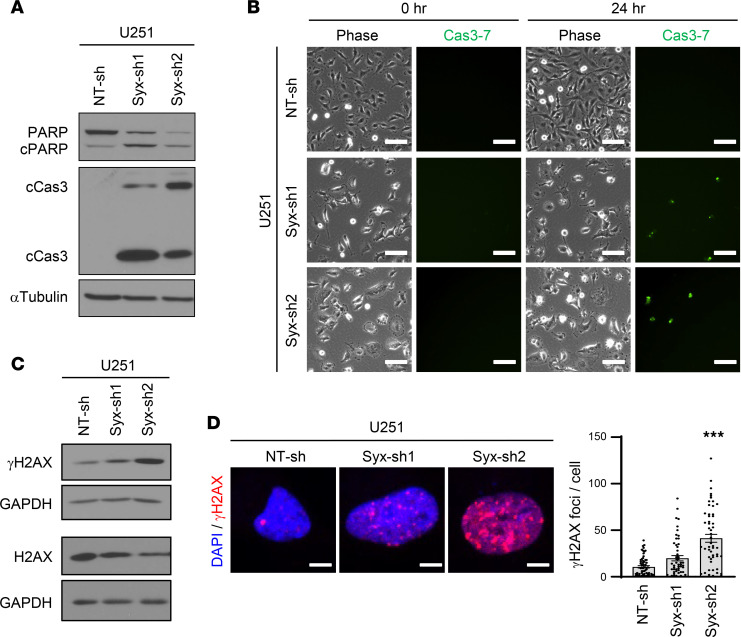
Figure 3. Syx depletion increases DNA damage.
(A) Immunoblot analysis of apoptotic markers — cleaved caspase 3 (cCas3) and cleaved PARP (cPARP) — and α-tubulin in lysates of U251 cells transduced with Syx shRNAs. The same samples with equal loading were run in parallel. (B) Phase contrast (Phase) and corresponding fluorescence images of activated effector caspases (caspases-3/7) using a Cas3-7 probe (2 biological repeats). Shown are images acquired at time 0 and 24 hours after addition of the Cas-3/7 probe. Scale bar: 100 μm. (C) Immunoblot analysis of phosphorylated H2AX at Ser-139 (γH2AX), total H2AX, and GAPDH in lysates of U251 cells expressing indicated shRNAs. The same samples for H2AX and γH2AX blots with corresponding GAPDH loading controls were run at different times (indicated by larger white space). γH2AX and GAPDH blots were run in parallel. (D) Immunofluorescence staining of nucleus (DAPI, blue) and γH2AX foci (red) in U251 cells expressing indicated shRNAs. Representative images are shown (left). Scale bar: 5 μm. Bar graph (right) depicts the average ± SEM number of γH2AX foci per cell in U251 cells transduced with indicated shRNAs (n > 50 cells per group). One-way ANOVA with Dunnett’s multiple-comparison test. ***P < 0.001.

