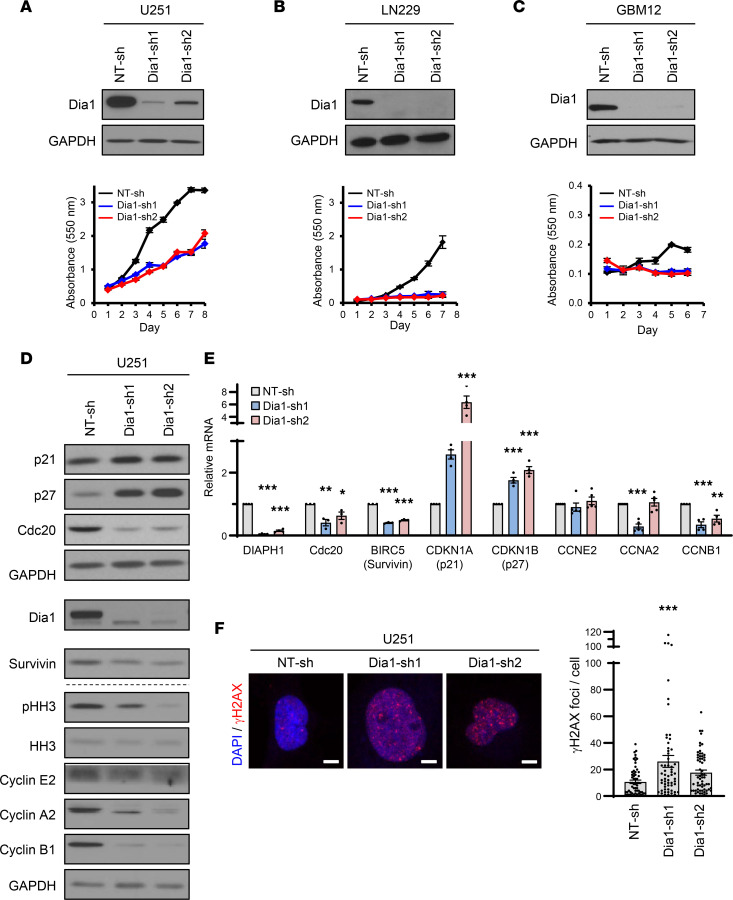
Figure 5. Dia1 is a downstream effector of Syx for the regulation of cell growth and gene expression.
(A–C) Immunoblot analysis of Dia1 and GAPDH in lysates of U251 (A), LN229 (B), or GBM12 (C) cells transduced with Dia1 shRNAs (top). Cell viability over the indicated time for each cell population was measured by the MTT assay (bottom). Shown are representative graphs (mean ± SD) of 3 biological repeats with 3 technical replicates each. (D and E) Immunoblot (D) and qPCR (E) analyses of phosphorylated histone 3 at Ser-10 (pHH3), total histone 3 (HH3), Cdc20, Survivin (BIRC5), p21 (CDKN1A), p27 (CDKN1B), Cyclin E2 (CCNE2), Cyclin A2 (CCNA2), and Cyclin B1 (CCNB1) in U251 cells expressing indicated shRNAs. Different biological samples are separated by dashed lines. Dia1 and Survivin blots were run at different times (indicated by larger white space). All other blots were run in parallel. Graph (E) represents the mean ± SEM of 3–5 biological replicates of relative mRNA expression of indicated genes normalized by GAPDH. (F) Representative images of immunofluorescence staining (left) show γH2AX (red) foci in the nucleus (DAPI, blue) of U251 cells expressing indicated shRNAs. Scale bar: 5 μm. Bar graph (right) depicts the average ± SEM number of γH2AX foci per cell in U251 cells transduced with indicated shRNAs (n > 60 cells per group). One-way ANOVA with Dunnett’s multiple-comparison test. *P < 0.05, **P < 0.01, ***P < 0.001.

